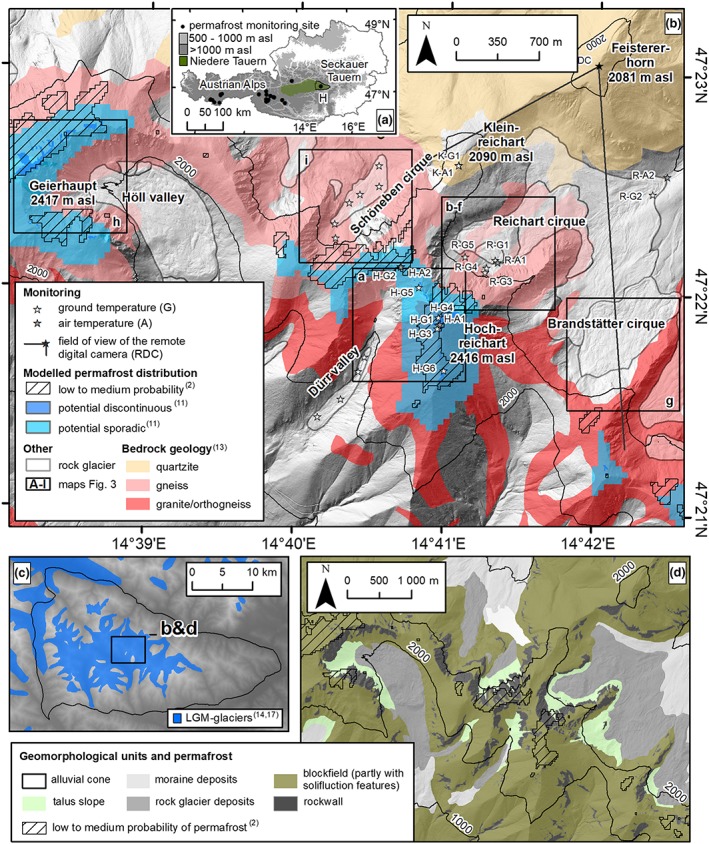
Figure 1.

Map of the study area. (a) Overview map with location of the Hochreichart area (H) in Austria. (b) Location of the relevant subareas shown in Figure 3, modeled permafrost distribution,2, 11 extent of rock glaciers, bedrock geology (simplified from ref.12) and different automatic monitoring sites (for explanation of codes see Table 2). (c) Extent of glaciers during the Last Glacial Maximum in the Seckauer Tauern (based on refs 13, 14). (d) Geomorphological overview map of the Hochreichart area with modeled permafrost extent [Colour figure can be viewed at http://wileyonlinelibrary.com]
