
Figure 3.
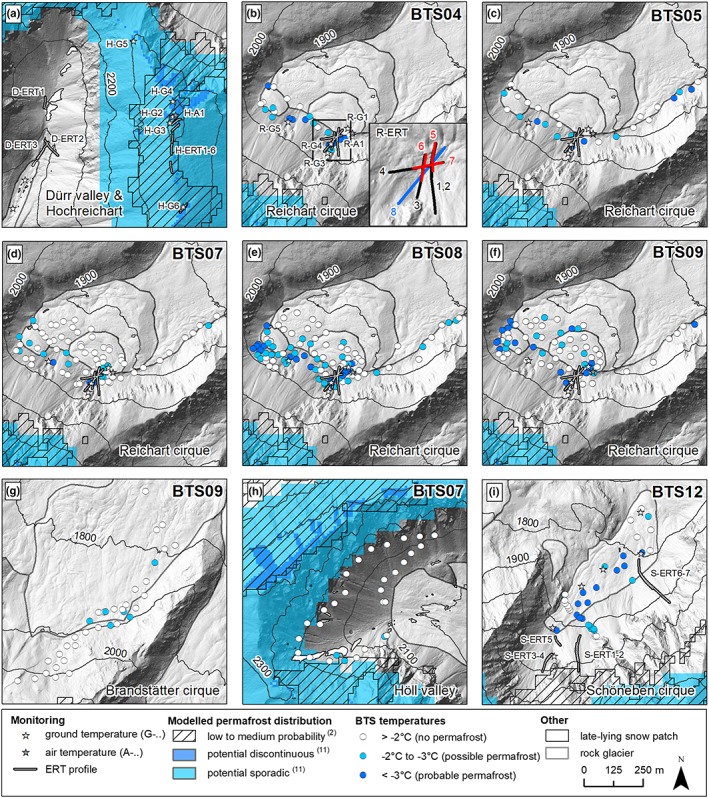
Maps of subareas of the Hochreichart area with location of monitoring sites (Tables 2), spatial extent of modeled permafrost distribution, late‐lying seasonal snow patches (July conditions), and results of nine different BTS campaigns between 2004 and 2012 (for details see Table 1). Modeled permafrost distribution are based on the literature2, 11 [Colour figure can be viewed at http://wileyonlinelibrary.com]