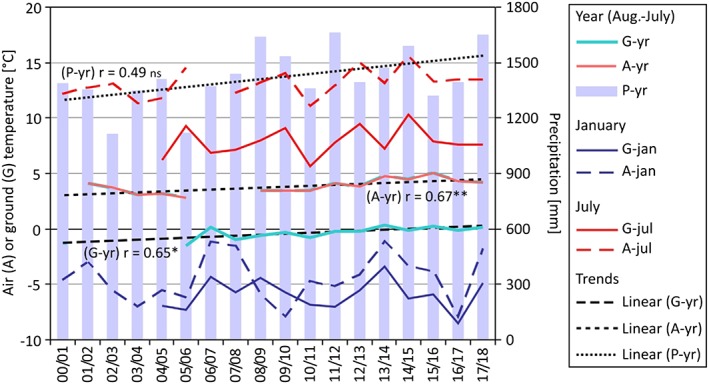
Figure 9.

Evolution of ground temperature (H‐G1 at 2,416 m a.s.l.; G), air temperature and precipitation (both R‐A2 at 1,512 m a.s.l.; A and P) between 2000 and 2018 in the Hochreichart area for annual and selected monthly (January, June) time series. Linear trends for annual means/sum are indicated. Significance: **P < 0.01, *P < 0.05, ns = not significant [Colour figure can be viewed at http://wileyonlinelibrary.com]
