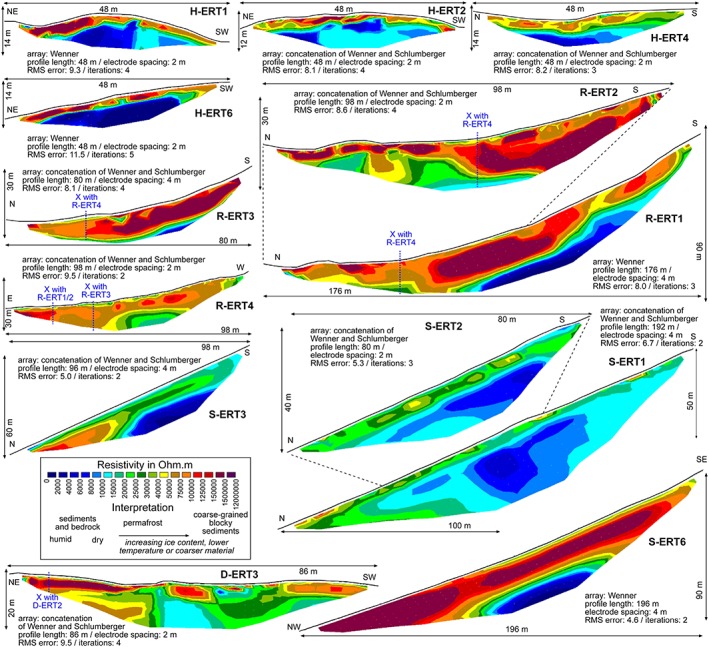
Figure 10.

Electrical resistivity tomography inversion results for 13 profiles measured in the study area. For technical details refer to Table 3. Locations of profiles are shown in Figure 3. “X” indicates the location where two ERT profiles intersect. Note that the spatial scale varies between profiles [Colour figure can be viewed at http://wileyonlinelibrary.com]
