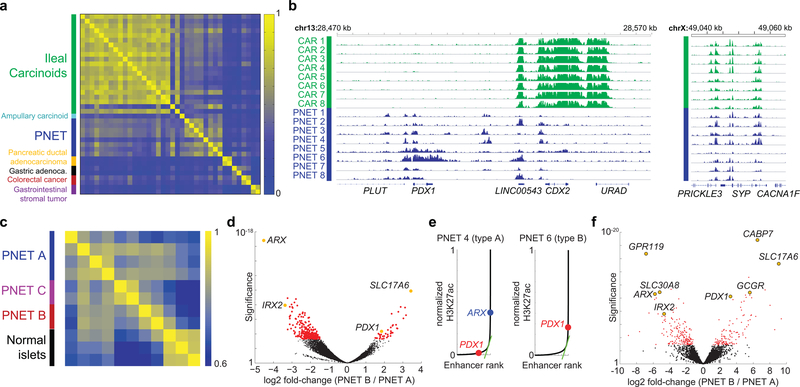
Figure 1. Distinctive PNET enhancer profiles.
(a) Pairwise Pearson correlations of H3K27ac signals at distal regulatory elements in diverse GI cancers. PNET and carcinoid (small intestinal NE) tumors differ from others, reflecting distinct cell origins. Whereas intestinal NE enhancer landscapes are highly concordant, PNETs appear heterogeneous. (b) Representative H3K27ac ChIP-seq tracks (16 of 30 samples), showing differential acetylation at the CDX2 and PDX1 loci; intronic SYP enhancers are marked in both intestinal (green) and pancreatic (blue) NETs. ChIP-seq read counts were scaled by DESeq2 normalization based on promoter signals (see Methods). (c) Pearson correlations of super-enhancer H3K27ac signals in PNETs and normal pancreatic islets suggest possibly 3 disease subtypes. (d) Significance (log10 scale, Wald test) and log2 fold-differences in H3K27ac ChIP-seq signals in A- and B-type PNETs, calculated by DESeq2 comparison of 6 biologically independent tumors. Each dot represents an individual site (red: false discovery rate, FDR <0.05). Selected H3K27ac sites are colored yellow and annotated by the nearest gene. (e) Normalized H3K27ac signals across all sites (super-enhancers lie to the right of the inflection) in single representative type A and type B tumors from 6 samples. (f) Significance (log10, Wald test) and log2 fold-differences of normalized mRNA read counts in A- and B-type PNETs (n=8 biologically independent tumors) considered as two groups. Each dot represents an individual gene (red: FDR <0.05). Left and right: transcripts enriched in types A and B, respectively. Transcripts associated with selected super-enhancers, including those highlighted in panel d, are indicated (yellow).

