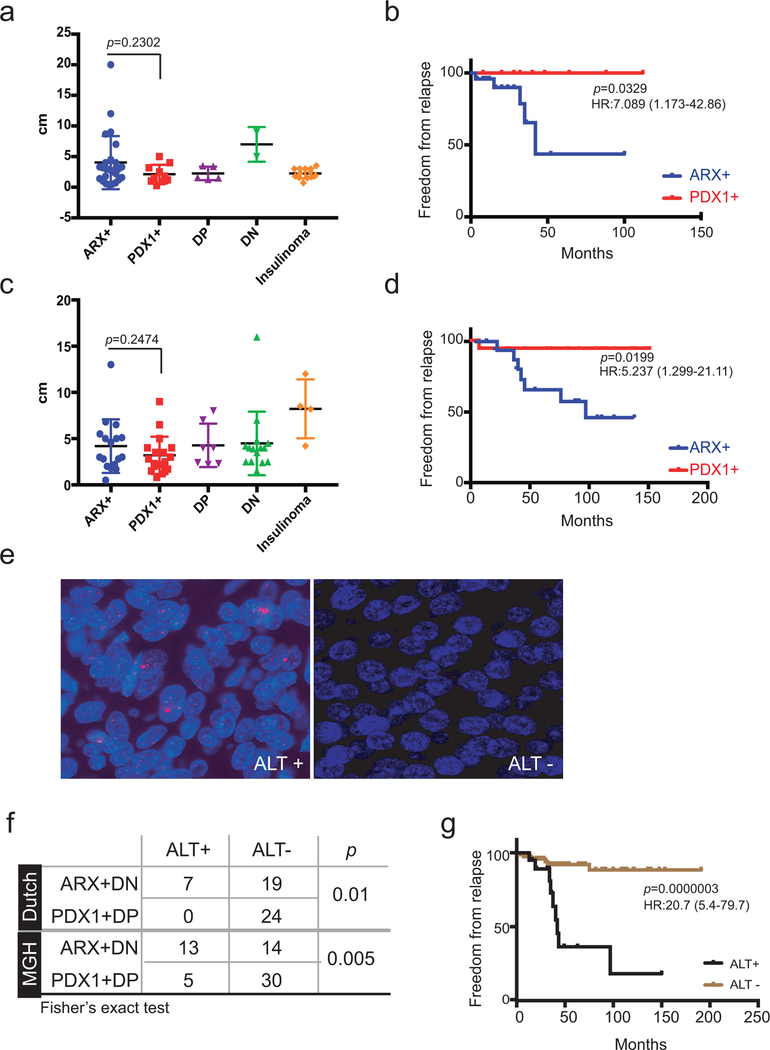
Extended Data Fig 6. Association of PNET subtypes with ALT status.
(a, c) Tumor size in all PNET sub-types in the Dutch (a, n=56 independent tumors) and MGH (c, n=61 independent tumors) cohorts. Bars represent mean ±SD. P-values for differences in size of primary ARX+ and PDX1+ tumors determined by Mann-Whitney test, 2-sided. (b, d) Analyses of recurrence-free survival in the Dutch (b, N=30 cases) and MGH (d, N=35 cases) cohorts when ARX+ and PDX1+ tumors were considered separately, ungrouped from DP and DN tumors. P values and hazard ratios were determined by 2-sided log-rank and Mantel-Haenszel tests, respectively. (e, f) Representative (e, 1 example each from 25 independent ALT+ and 87 independent ALT− cases) and aggregate (f, n=112 biologically independent cases) results of telomere-specific FISH in cases classified as positive or negative for ALT. The statistical test was 2-sided. (g) Kaplan-Meier analysis of disease-free survival in all 112 cases with ALT data from both cohorts, without consideration of PNET sub-type.

