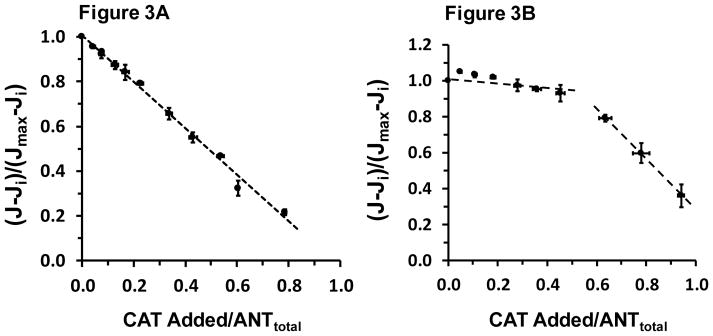
Figure 3.
Respiration rate at 310 K is titrated out with stepwise additions of carboxyatractyloside (CAT) at a clamped [ADP]f of 21 μM (Panel A) and at saturating (2 mM) ADP (Panel B). In Panel A the regression equation of the broken line is: y = 1.00 – 1.04x, R2 = 0.994. In Panel B, the apparent breakpoint at about 0.5 total ANT was arbitrarily used to evaluate two regression equations, the first nearly flat and a second steep slope reflecting maximal ANT turnover. On the ordinates “Ji” is Jo remaining after maximum CAT inhibition and “Jmax” is Jo prior to the first CAT addition. In both panels, each point is the mean ± SE with both x- and y-error bars of 6–9 values.

