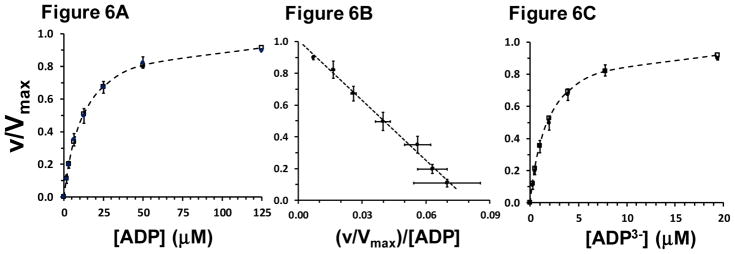
Figure 6.
Luciferase assay to evaluate ADP and ADP3− kinetics of oxidative phosphorylation rate (Jp). Filled symbols, all n=6, show mean ± SE (error bars in both x and y dimensions). In panels A and C, open symbols and dashed lines show nonlinear fit of Equation 1 to the data. Panel A: Analyzed kinetic parameters were KmADP = 13.1 ± 1.9 μM and Hill coefficient, nH = 1.05 ± 0.02. Panel B: Eadie-Hofstee plot of the same data shown in Panel A. The equation of the line for mean data was: y = −12.6x + 1.01, R2 = 0.993. Panel C: Analyzed kinetic parameters in terms of the ADP3− ion were: KmADP3− = 2.0 ± 0.3 μM and Hill coefficient, nH = 1.05 ± 0.02. Rates are expressed in units relative to Vmax.

