Figure 7.

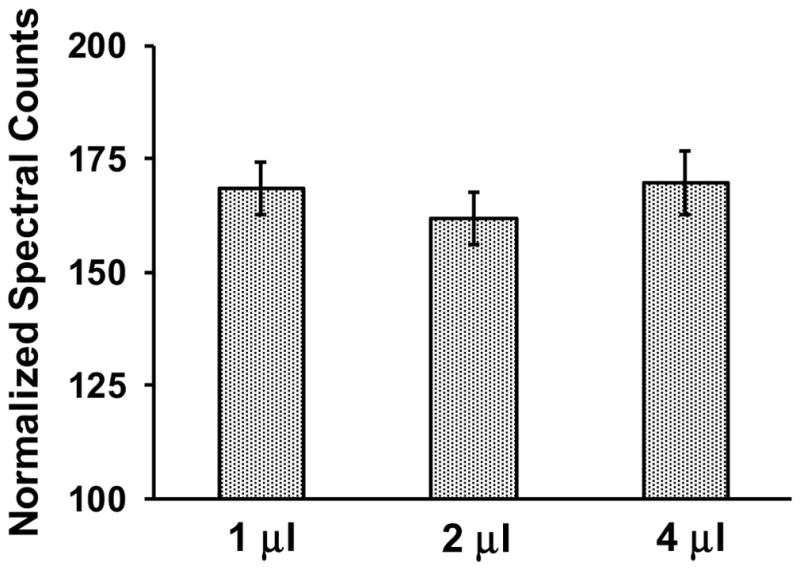
In mass spectrometry-based proteomic assessments, the relative abundance of ANT1 was independent of the sample volume analyzed across a four-fold range with a coefficient of variation of approximately 6%.

In mass spectrometry-based proteomic assessments, the relative abundance of ANT1 was independent of the sample volume analyzed across a four-fold range with a coefficient of variation of approximately 6%.