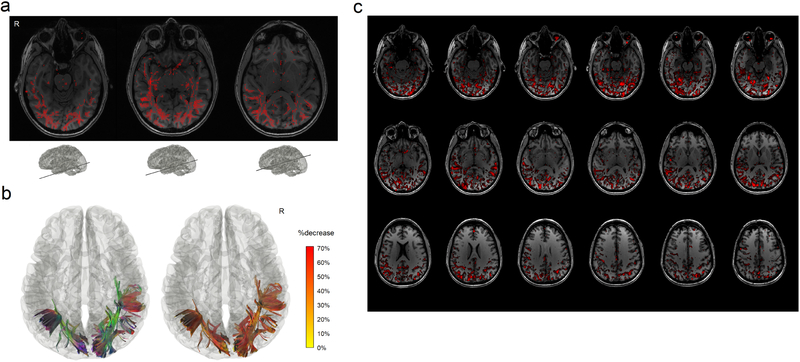
Fig. 3.
Differential tractography of a multiple sclerosis patient with the first episode of optic neuritis. (a) The intermediate result of differential tractography shows red sticks indicating local fiber orientations with a negative change threshold of 30% between repeat scans. The sticks are mostly distributed along the primary visual pathways, while sporadic false findings can also be found throughout the entire whiter matter regions due to local signal variations. (b) The red sticks are tracked and connected into continuous trajectories, whereas the other unaffected parts of the white matter pathways are ignored. The resulting 3D presentation is the differential tractogram of the patient showing the exact segment of pathways with a substantial decrease in anisotropy. The tractography can be rendered by directional colors (left) or severity-coded color (right) to provide information about the spatial location, and the severity of the axonal damage can be quantified by percentage decrease of anisotropic diffusion. (c) The same data analyzed by voxel-based differences show numerous fragmented findings, possibly due to numerous local random error. There is no track information to assist correlating structure with a function and differentiating true findings from false ones.

