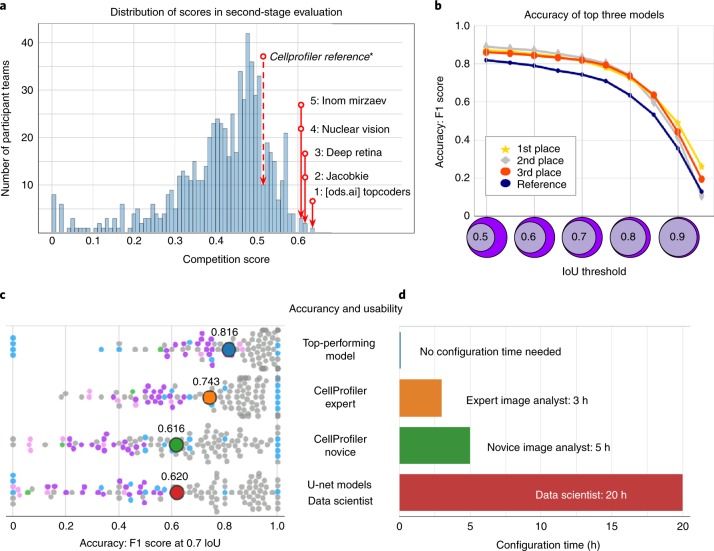
Fig. 1. Accuracy and usability of segmentation strategies in the second-stage holdout sets.
a, The histogram counts participant teams (n = 739) according to the official competition score of their best submission. The top five competitors are labeled in the distribution, as is the reference segmentation obtained by an expert analyst using CellProfiler. b, Accuracy of the top three solutions measured as the F1 score at multiple IoU thresholds. The scale of the x axis of the histogram in panel a (competition score) is correlated with the area under the curve of the F1 score versus IoU thresholds. The top three models had a similar performance with slight differences at the tails of the curves. c, Breakdown of accuracy in the second-stage evaluation set for the top performing model and three reference solutions. The distribution of F1-scores at a single IoU threshold (IoU = 0.7) shows points (n = 106) that each represented the segmentation accuracy of one image in the set of 106 annotated images of the second-stage evaluation (Methods). The color of single-image points corresponds to the group of images defined for reference evaluations (Methods and Fig. 2). The average of the distribution is marked with a larger point labeled with the corresponding average accuracy value. d, Estimated time required to configure the segmentation tools evaluated in c (Supplementary Note 4).

