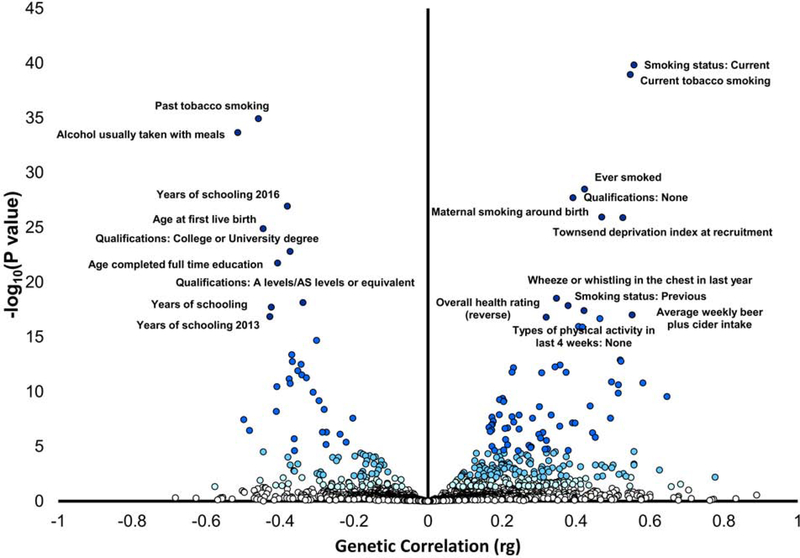
Figure 3.
Phenome-wide genetic-correlation analysis. Blue shades corresponds to significance strength, from white, non-significant (p > 0.05), to very light blue (p < 0.05), light blue (FDR q < 0.05), to blue (Bonferroni correction p < 2.81 × 10−40), and dark blue (top-20 results). Phenotype labels are included for the top 20 results.

