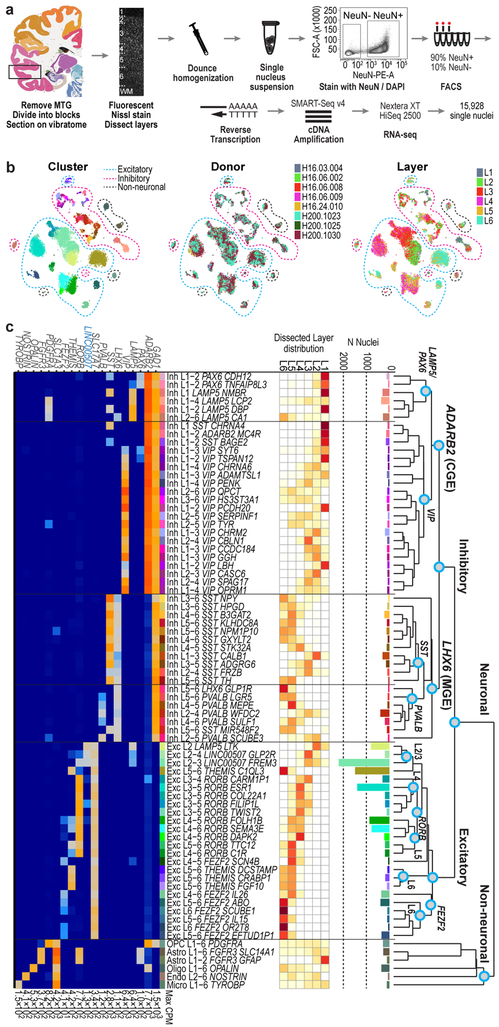
Figure 1. Cell type taxonomy in human middle temporal gyrus (MTG).
a, Schematic of RNA-sequencing of neuronal (NeuN+) and non-neuronal (NeuN-) nuclei isolated from human MTG. Human brain atlas image from http://human.brain-map.org/ b, t-SNE visualization of 15,928 nuclei grouped by expression similarity and colored by cluster, donor, and dissected layer. c, Taxonomy of 69 neuronal and 6 non-neuronal cell types based on median cluster expression. Branches are labeled with major cell classes. Cluster sizes and estimated laminar distributions (white, low; red, high) are shown below. d, Median log-transformed expression of marker genes (blue, non-coding) across clusters with maximum expression (CPM) on the right.

