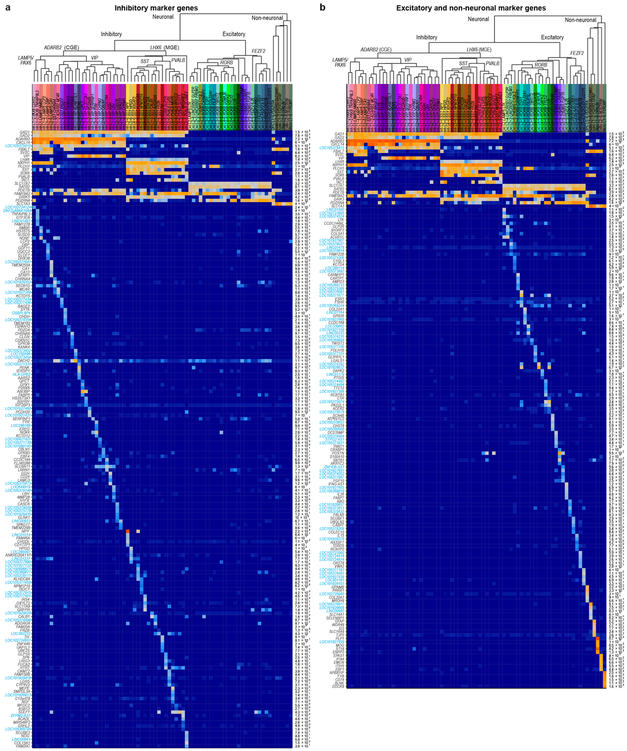
Extended Data Figure 4. Expression of cell type specific markers.
a, b, Heatmaps of the top cell type markers for (a) inhibitory neurons and (b) excitatory neurons and non-neuronal cell types. Markers include many non-coding and unannotated genes (blue symbols). Median expression values are shown on a logarithmic scale, with maximum expression values shown on the right side of each row. Up to 5 marker genes are shown for each cell type. Note that LOC genes were excluded from cluster names, and the best non-LOC marker genes were used instead. Dendrograms and cluster names are reproduced from Figure 1. Marker genes for broad classes, as defined manually and using NS forest, are also shown in the top rows of each heatmap.

