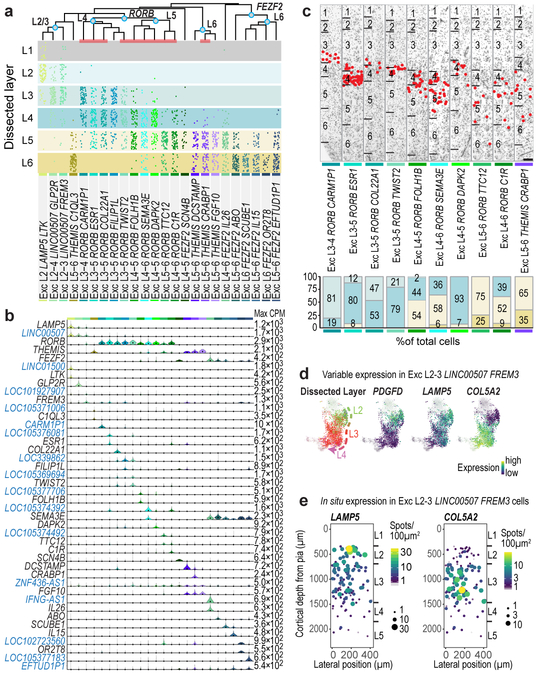
Figure 2. Excitatory neuron diversity and marker gene expression.
a, Estimated layer distributions of cell types based on dissected layer of nuclei (dots). Layer 1 dissections included some excitatory neurons from layer 2. b, Violin plots of marker gene (blue, non-coding) expression distributions across clusters (n=10,525 nuclei). Rows are genes, black dots are median expression, and maximum expression (CPM) is on the right. c, Representative inverted images of DAPI-stained cortical columns with cells (red dots) in each cluster (red bars in a) identified using listed marker genes. Experiments repeated on ≥2 donors per cell type. Scale bar, 250 μm. Bar plots summarize layer distributions for at least n=2 donors per cell type. d, t-SNE maps of superficial excitatory neurons with nuclei in the Exc L2-3 LINC00507 FREM3 cluster (n=2,284) colored by dissected layer and expression of PDGFD, LAMP5, and COL5A2. e, Single molecule fluorescent in situ hybridization (smFISH) quantification of LAMP5 and COL5A2 expression.

