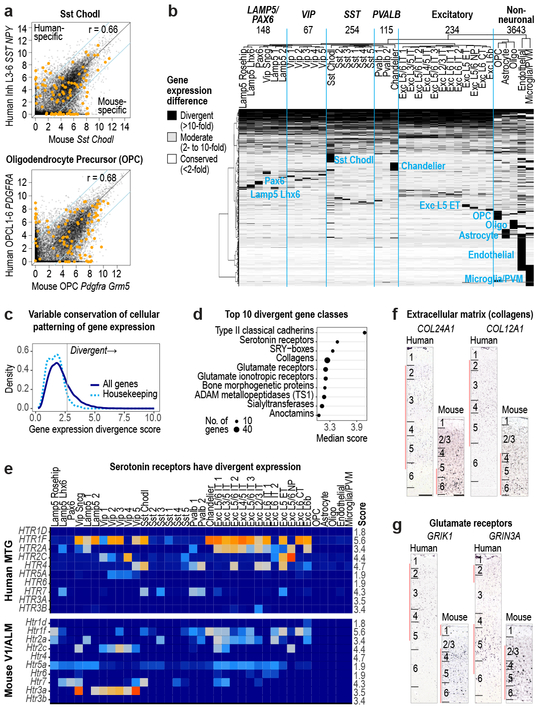
Figure 6. Divergent cell type expression between human and mouse.
a, Comparison of expression levels of 14,553 orthologous genes between human and mouse for Sst Chodl and OPCs. Genes outside the blue lines have highly divergent expression (>10-fold change) and include cluster specific markers (orange dots). Benjamini & Hochberg Pearson correlation (r). b, Patterns of expression change between human and mouse for 9748 divergent genes (67% of orthologous genes). Groups of genes with similar patterns are labeled by the affected cell class. Top row: number of genes with expression divergence restricted to each broad class of cell types. c, Distribution of scores (Methods) that measures the magnitude of expression change across homologous cell types for all genes (dark blue) and housekeeping genes (light blue). d, Gene families (n > 10 genes) with the most divergent expression patterns (highest score) include neurotransmitter receptors, ion channels, and cell adhesion molecules. e, Expression (trimmed average CPM) of most serotonin receptors has changed in homologous cell types. Scores listed on far right. f, g, ISH of divergent genes show shifts in laminar expression consistent with different cell type expression in human and mouse. Red bars show layers with enriched expression. Scale bars: human (250 μm), mouse (100 μm).

