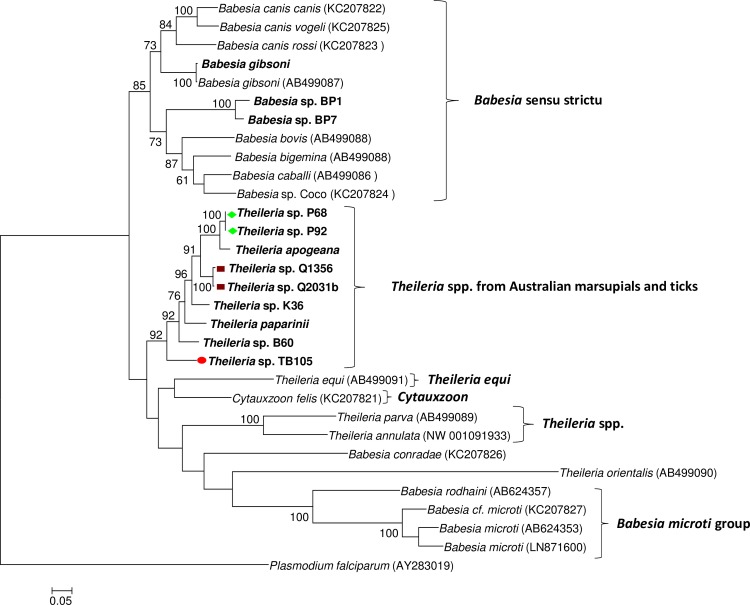
Fig 3. Phylogenetic analysis of cytB nucleotide sequences from Australian piroplasms and other piroplasms for which cytB sequences are available in GenBank.
Phylogenetic relationships among sequences (~1.1 kb) were inferred using the maximum likelihood method. Names in bold represent sequences obtained in the present study from marsupial blood samples (Table 1) and positive piroplasm 18S rDNA samples obtained during previous studies (Table 2). Symbols at the left of each sequence correspond to the clades identified in the phylogenetic analysis at the 18S rRNA locus (Fig 1).

