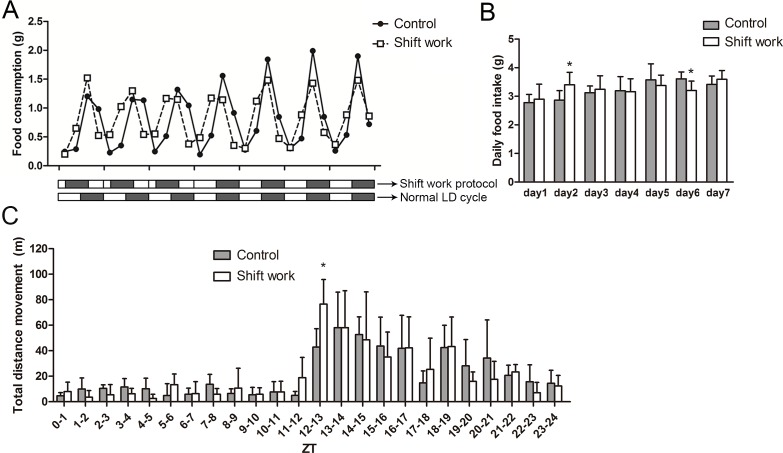
Fig 5. The effect of shift work on feeding rhythm and activity rhythm.
(A) Food intake rhythms in control and shiftwork mice were monitored over a seven-day period. One scale on the X-axis represents one day. Corresponding light-dark patterns were exhibited as bars below the X-axis (up: shift work condition; down: normal light-dark (LD) condition), in which the light phase is indicated by a white bar while the dark phase is indicated with a black bar. The data are mean values from 8–10 mice in each group. For each day, food intake during ZT0–6, 6–12, 12–18 and 18–24 were represented by 4 consecutive data points, respectively. (B) Total food intake of control and shift work mice over a seven-day cycle. N = 8–10/day/group. (C) Average locomotor activity (meter per hour) in control and shift work mice on the fifth day of the fifth week (n = 4 per group). ZT0–12 represents the light phase and ZT12–24 represents the dark phase. *P<0.05.

