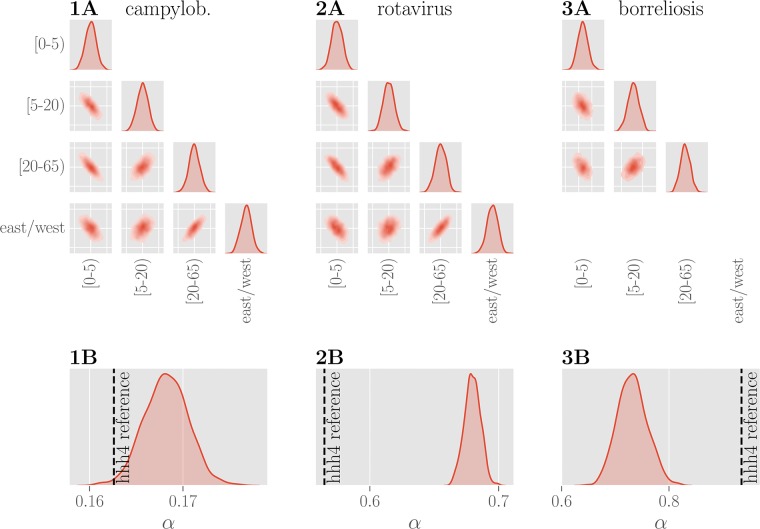
Fig 5. Learned weights for political and demographic components.
Plots of the pairwise marginal distributions between inferred coefficients for three age groups and the east/west component for all three diseases are shown in row A. The marginal distribution of each coefficient shows a narrow unimodal peak, yet the pairwise distributions show that the individual features are clearly not independent. Row B shows the inferred posterior distributions of the overdispersion parameter α for three diseases. Values of α obtained using the hhh4 reference model are indicated with a dashed black line. The inferred values for the dispersion parameter α are different, yet of similar magnitude, between the two models.

