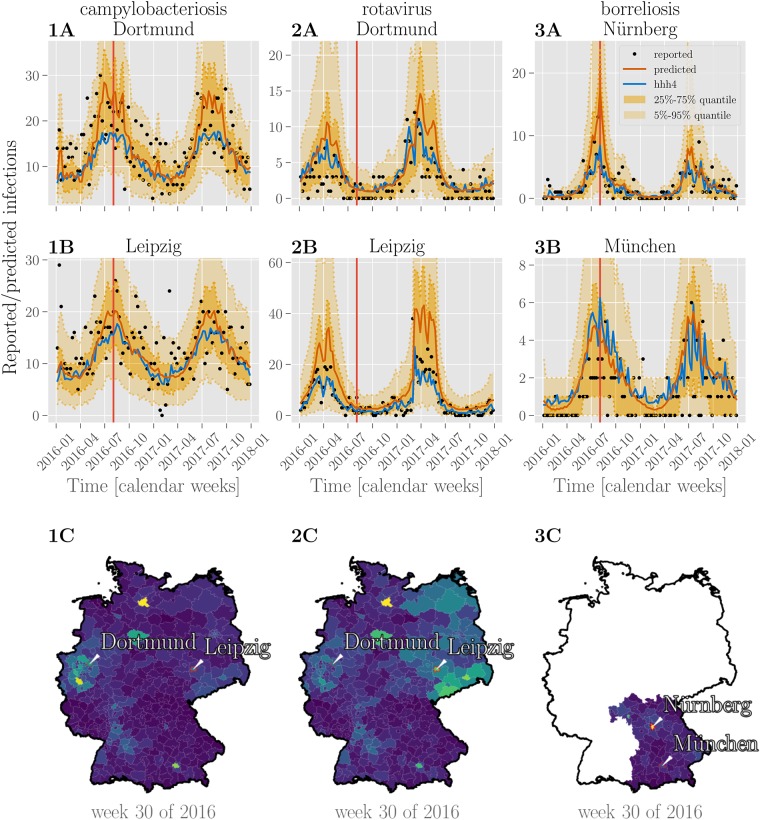
Fig 6. Predictions of case counts for various diseases by county.
Reported infections (black dots), predictions of case counts by BSTIM (orange line) and the hhh4 reference model (blue line) for campylobacteriosis (column 1), rotavirus (column 2) and borreliosis (column 3) for two counties in Germany (for campylobacteriosis and rotavirus) or Bavaria (borreliosis), are shown in rows A and B. The shaded areas show the inner 25%-75% and 5%-95% percentile. Row C shows predictions of the respective disease for each county in Germany or the federal state of Bavaria in week 30 of 2016 (indicated by a vertical red line in rows A and B). Information about the shape of counties within Germany is publicly provided by the German federal agency for cartography and geodesy (Bundesamt für Kartographie und Geodäsie) (GeoBasis-DE / BKG 2018) under the dl-de/by-2-0 license.

