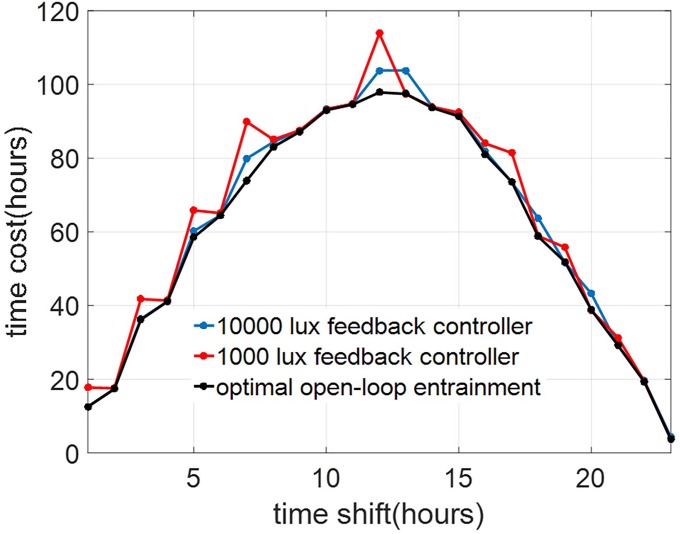
Fig 17. Performance of the optimal feedback controllers trained using data from the cases of circadian light intensities of 1000 and 10000 lux (red and blue curves, respectively) applied to the case of circadian light intensity of 5000 lux.
Observe that the feedback controllers perform quite well compared to the actual optimal solutions (black curve).

