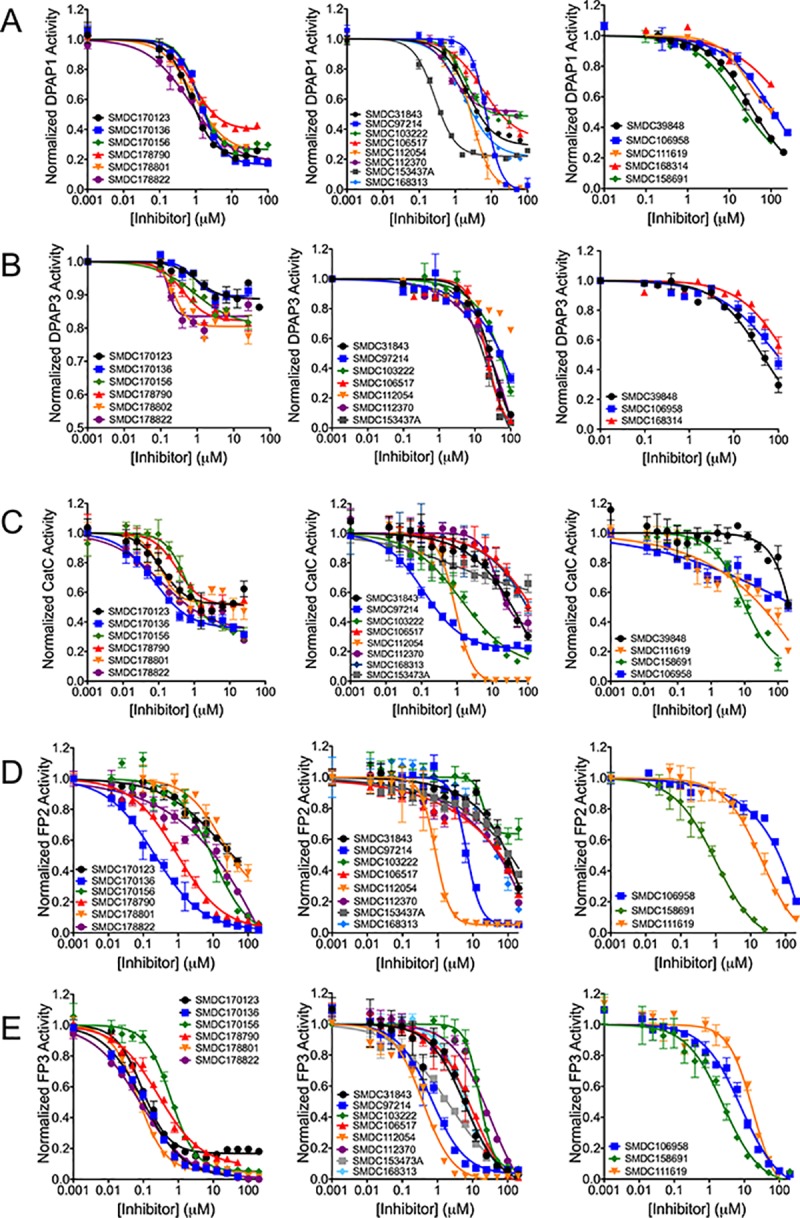
Fig 4. Dose response inhibition curves for hit compounds.

The inhibitory effect of purchased compounds against DPAP1 (A), DPAP3 (B), CatC (C), FP2 (D) or FP3 (E) was tested at different compound concentrations using different fluorogenic substrates. Substrates were used at the Km concentration of each enzyme to obtain comparable IC50 values. Protease activity was normalized to the DMSO control. Each dose-response was fitted to Eq 1. Structurally related DOPTACN compounds are shown on the left graphs. Compounds for which solubility issues prevented us from obtaining a maximum inhibition baseline for DPAP1 are show on the right graphs. The remaining compounds are presented in the middle graphs. IC50 and maximum percentage inhibition values are reported in Tables 1 and 2. All dose-response were performed in triplicate. Error bars represent standard errors.
