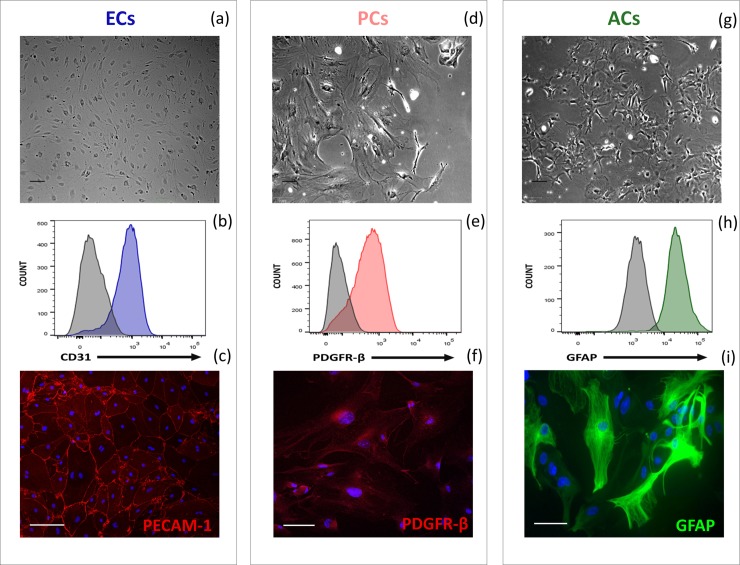
Fig 1. Identification of isolated brain cells from mice.
(a, b, c) Endothelial cells (ECs) at P1; (d, e, f) Pericytes (PCs) at P3; (g, h, i) Astrocytes (ACs) at P1. (a, d, g) Differential interference contrast (DIC) images (× 20) of the above-mentioned cell types. (b, c) Platelet endothelial cell adhesion molecule 1 (PECAM1, CD31), (e, f) beta-type platelet-derived growth factor receptor (PDGFR-β) and (h, i) glial fibrillary acidic protein (GFAP) protein expression as assessed by (b, e, h) flow cytometry and (c, f, i) immunofluorescence confocal microscopy (× 40). Representative of n = 5. (b, e, h) Mean fluorescence intensity plots (control isotype in grey) are shown. (c, f, i) Nuclei were stained with DAPI (blue). Scale bars represent 100 μm.

