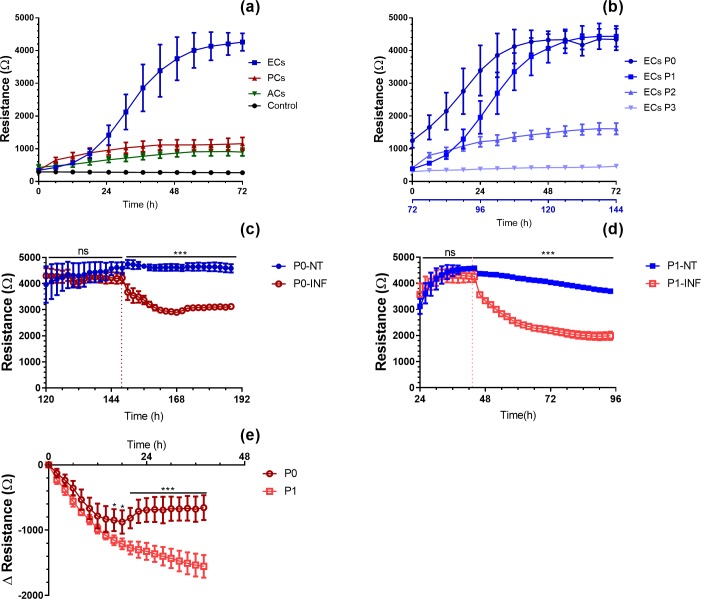
Fig 2. Electrical resistance of primary cultures of pericytes, astrocytes and endothelial cells, as measured by ECIS Zθ.
(a) Transcellular electrical resistance comparison between pericytes (PCs), astrocytes (ACs) and endothelial cells (ECs) at passage 1 (n = 4). (b) Transendothelial electrical resistance measured from P0 to P3. The second x-axis in (b) is used to compare ECs (P0) to the other passages at similar resistance values (n = 4). (c, d) Transcellular electrical resistances of confluent monolayers of ECs at (c) passage 0 (P0) or (d) passage 1 (P1) either inflamed with 100 U/ml of TNF-α and IFN-γ (INF) or non-treated (NT) (P0: n = 5, P1: n = 4). The vertical dotted lines denote the addition of the pro-inflammatory cytokines. (e) Transcellular electrical resistance comparison of P0 and P1 ECs treated with TNF-α and IFN-γ (normalized at the treatment time point). Two-way ANOVA; * P-value ≤ 0.05, ** P-value ≤ 0.01, *** P-value ≤ 0.001. Each point represents the mean resistance measured every 6 hours (a, b) or 2 hours (c, d, e) ± standard deviations.

