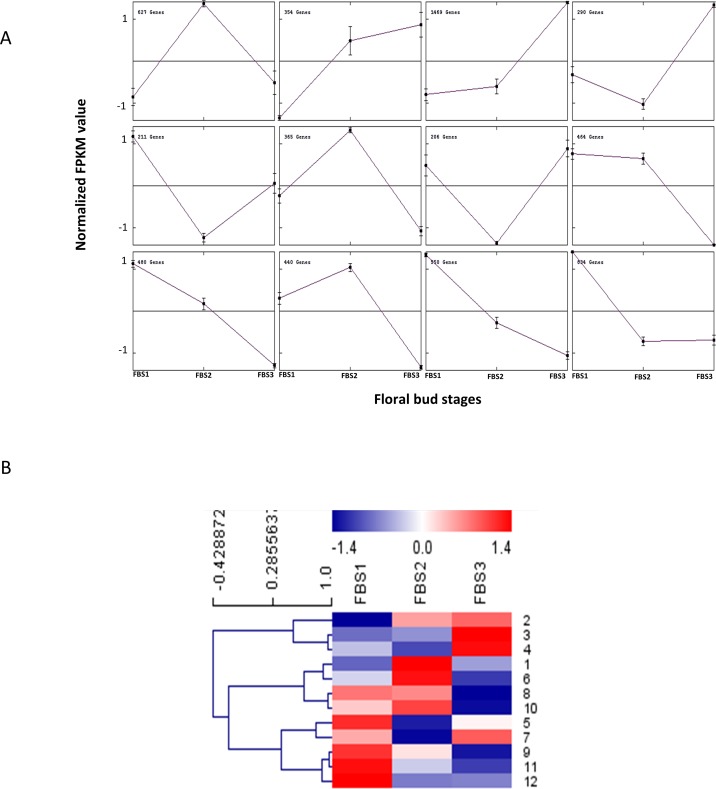
Fig 5. Expression profile analysis of DEGs in Rafflesia cantleyi floral bud development.
(A) MeV cluster analysis of DEGs from the expression profiles across three floral bud stages (FBS1, FBS2 and FBS3). Main line in each of the 12 cluster graphs indicates the average expression level of transcripts grouped into the same cluster under different floral bud stages. (B) Heatmap for cluster analysis of the DEGs by the K-means method with reference to the scale bar at the top of the figure.

