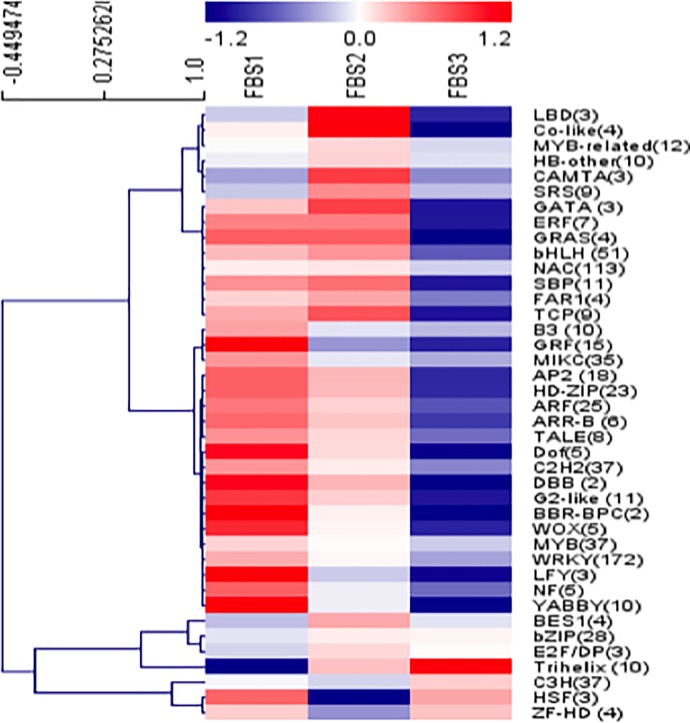
Fig 6. Analysis of transcription factors associated with flower development in Rafflesia cantleyi.
A heat map depicting the overall trend of the differential expression profiles of the transcription factor during flower development with reference to the scale bar at the top of the figure. The number of DEGs in each transcription factor family is shown in parentheses.

