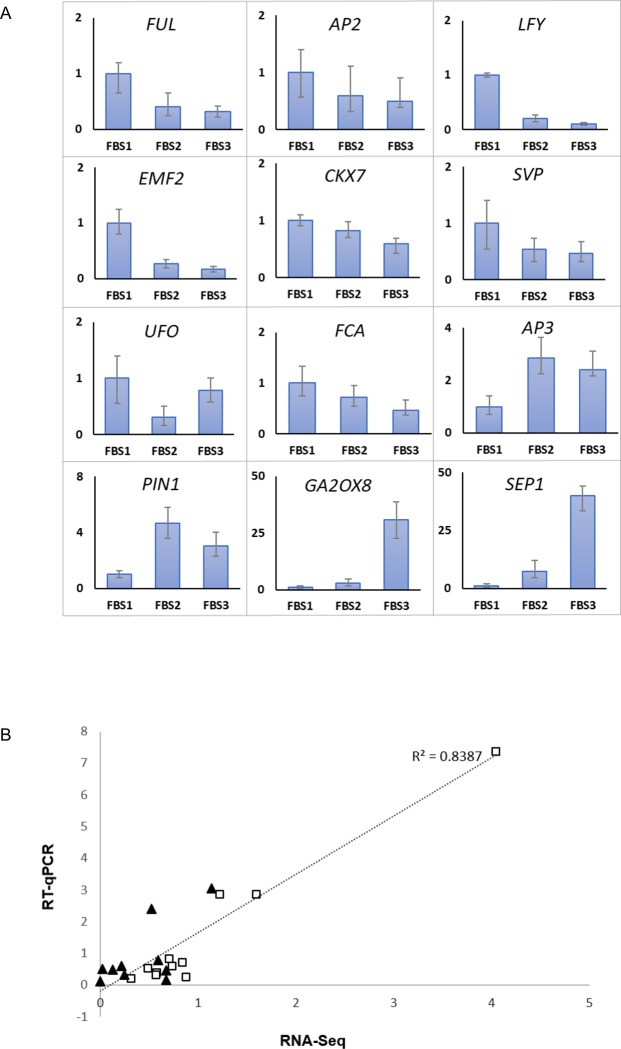
Fig 8. RT-qPCR validation of RNA-seq analysis.
(A) Expression of twelve genes related to flower development in different stages of R. cantleyi floral bud development based on three independent biological replicates. Error bars show ± SD of three technical replicates of the three biological replicates. (B) Scatter plot of fold change (FC) of 12 selected gene expression ratios from RT-qPCR and RNA-Seq data. Squares correspond to FBS1-FBS2 and triangles correspond to FBS1-FBS3 comparison.

