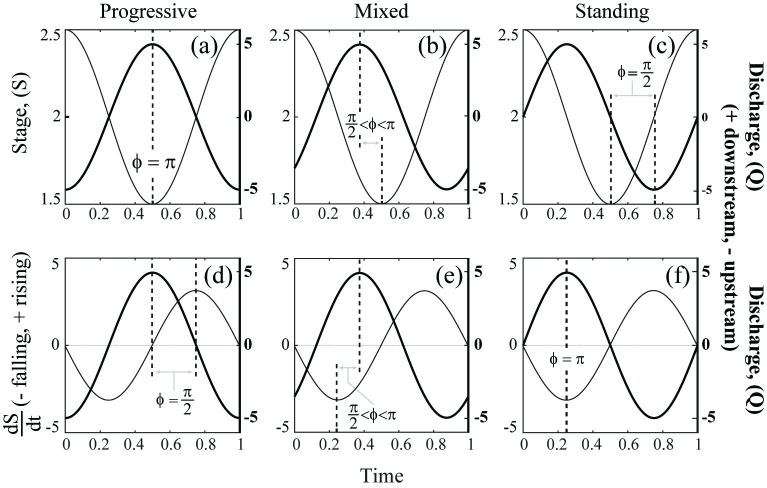
Fig 1. Conceptual schematic of progressive, mixed, and standing waveforms.
Schematic of relationships between stage (S) and discharge (Q) (first row) and between stage-rate-of-change (dS/dt) and discharge (second row) through time, for progressive (a, d), mixed (b, e), and standing (c, f) waveforms. Thicker line and right y-axes represent Q(t), thinner lines and left y-axes represent S(t) or dS(t)/dt. Absolute magnitude of phase offset (| ϕ |) between S and Q is the space between the dashed lines. The figure was composed using MATLAB from a hypothetical dataset.

