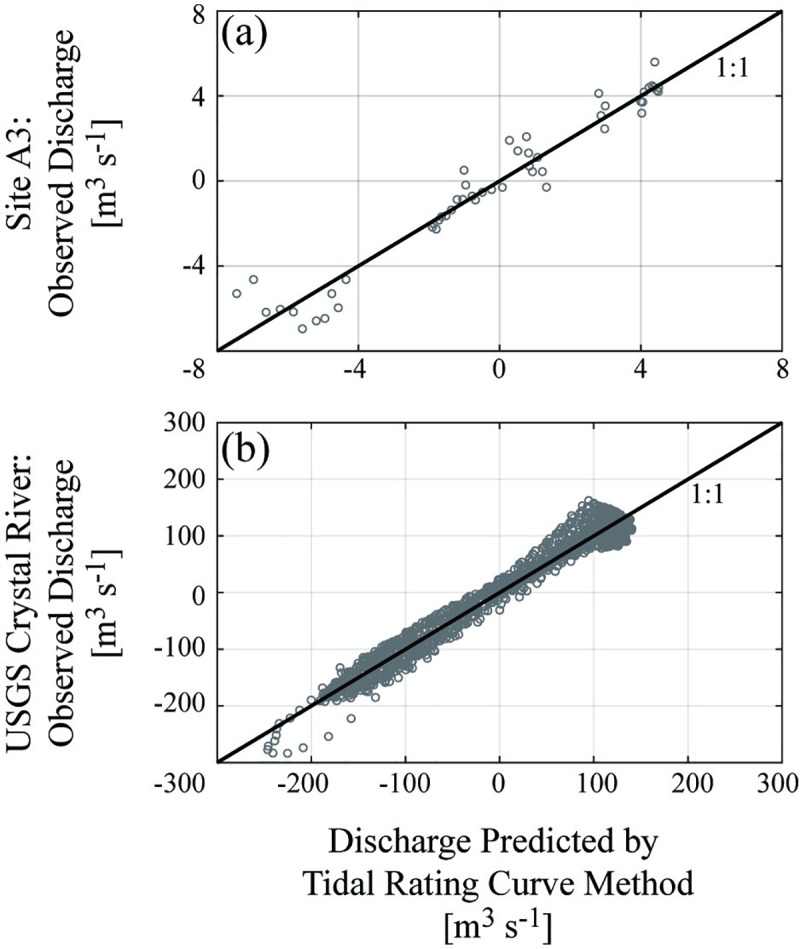
Fig 4. Comparison of observed and modeled discharge at two standing wave sites.

Example comparisons of baseflow discharge data from M-A site A3 observed by ADP surveys (a) and at the USGS Crystal River gauge (b) versus discharges modeled by the tidal rating curve method. The solid line represents the 1:1 ratio. Predictions at site A3 exhibited R2 = 0.94, while predictions at the USGS Crystal River site displayed R2 = 0.97. Visualization created using MATLAB software.
