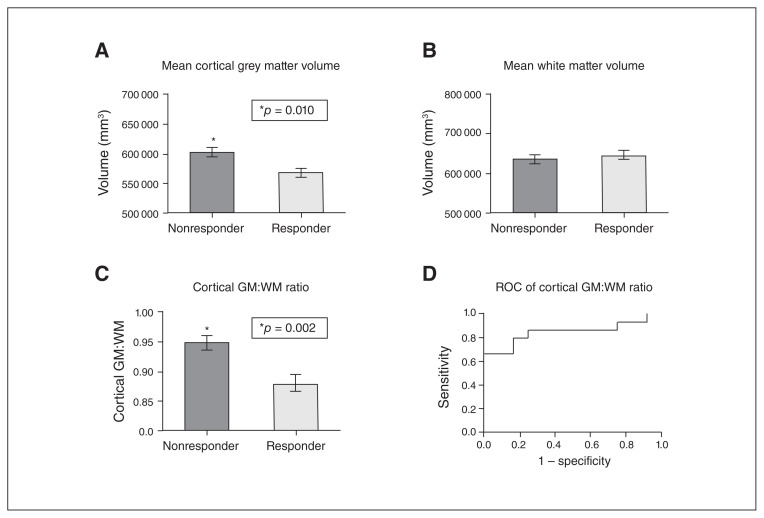
Fig. 4.
(A) Mean cortical grey matter volume in responders versus nonresponders to deep brain stimulation of the subcallosal cingulate gyrus. (B) Mean white matter volume in responders versus nonresponders. (C) Mean cortical grey matter:white matter ratio in responders versus nonresponders. (D) Receiver operating characteristic of cortical grey matter:white matter ratio, showing that cortical grey matter:white matter ratio can distinguish between responders and nonresponders with high sensitivity and specificity. All between-group statistical comparisons in A to C were performed using the Mann–Whitney test. GM = grey matter; WM = white matter.

