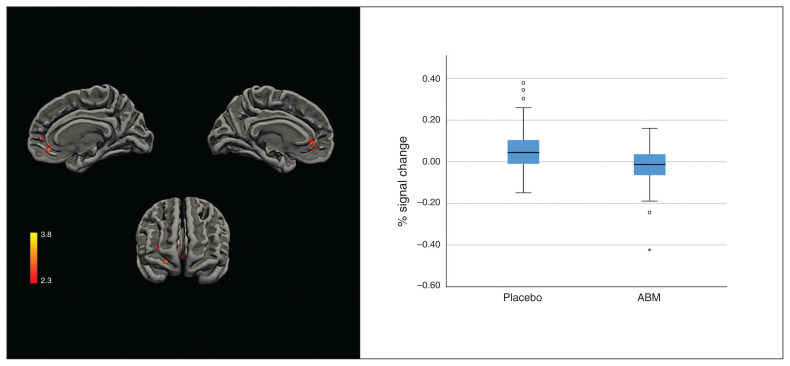
Fig. 1.
Left: cluster activation (Z > 2.3) for placebo over attentional bias modification (ABM) for the AttendNegative > AttendNeutral contrast. Right: distribution of individual percentage signal changes over significant clusters; solid line indicates the median; box indicates the 50th percentile of the median; whiskers indicate 95% confidence intervals; dots indicate potential outliers (1.5 standard deviation [SD] outside the 50th percentile of the median); asterisk indicates an extreme outlier (3 SD outside the 50th percentile of the median).

