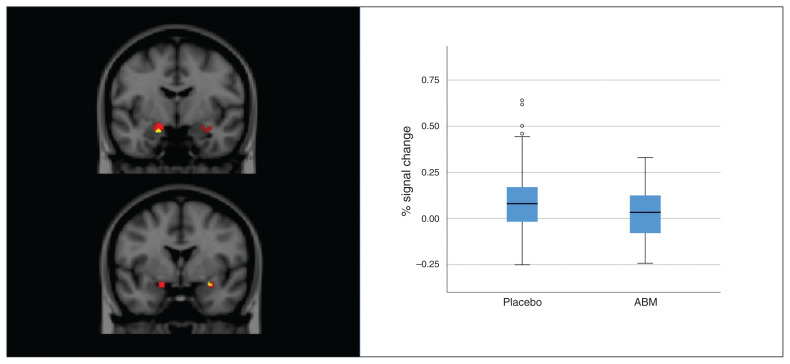
Fig. 2.
Amygdala activation for the AttendNegative > AttendNeutral contrast. Left: red voxels represent mean amygdala activation across placebo and attentional bias modification (ABM) training groups. Yellow voxels are superimposed and represent peak voxels where the placebo group had more activation than the ABM group. Right: distribution of individual percentage signal changes over significant clusters; solid line indicates the median; box indicates the 50th percentile of the median; whiskers indicate 95% confidence intervals; dots indicate potential outliers (1.5 standard deviation outside the 50th percentile of the median).

