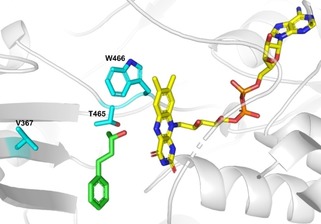
Figure 2.

Docking of substrate 2 a (in green) into HMFO V465T (PDB 6F97). The FAD is shown in yellow and residues selected for site‐directed mutagenesis are highlighted in blue (V367, T465, and W466). Docking was performed with Yasara. The figure was prepared using PyMol.15b
