
Figure 2.
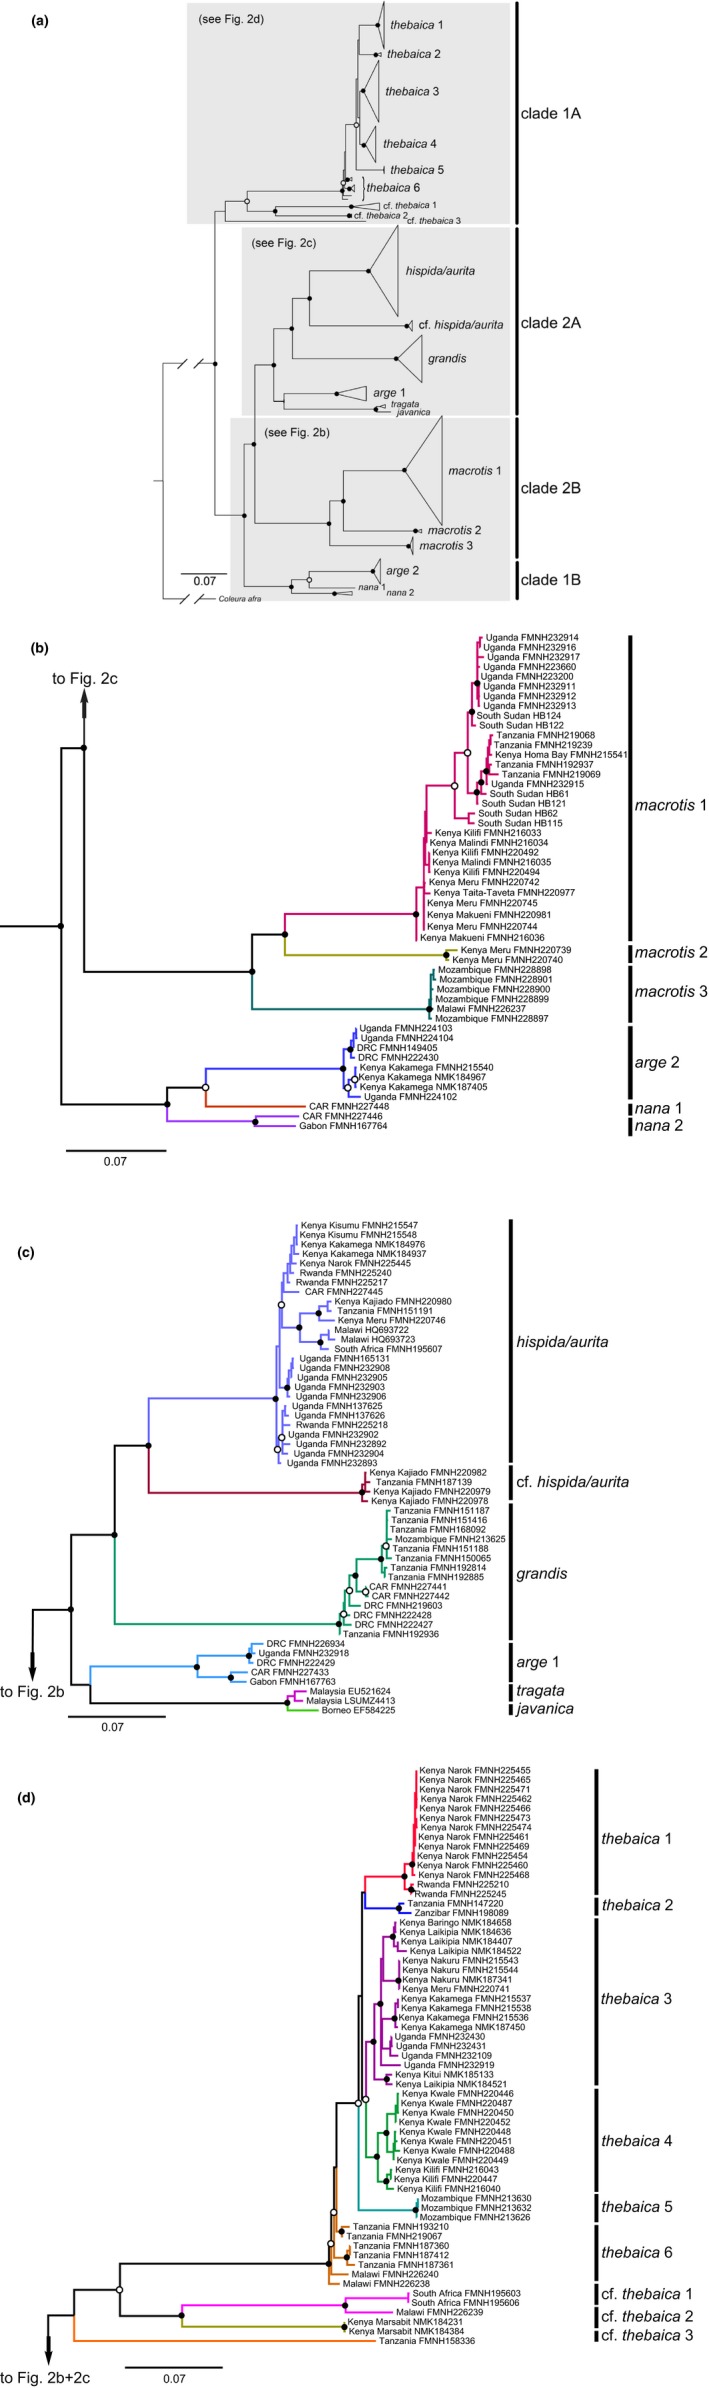
(a) Maximum‐likelihood phylogeny of 163 Nycteris specimens based on cytochrome b. The phylogeny was inferred in IQ‐TREE and its topology closely resembled the phylogeny calculated in MrBayes under a Bayesian framework. Filled circles on nodes denote bootstrap values (BS) ≥70% and Bayesian posterior probabilities (PP) ≥0.95, open circles outlined in black indicate BS ≥ 70% and PP < 0.95, and unmarked nodes indicate BS < 70% and PP < 0.95. Support values for most minor clades are not shown. Species names assigned on basis of preliminary field identifications or examination of museum specimens. (b–d) enlarged sections of the complete cytb tree showing individual relationships. Specimen localities include counties for densely sampled Kenya. CAR refers to Central African Republic and DRC to Democratic Republic of the Congo. Museum acronyms are defined in Appendix 1