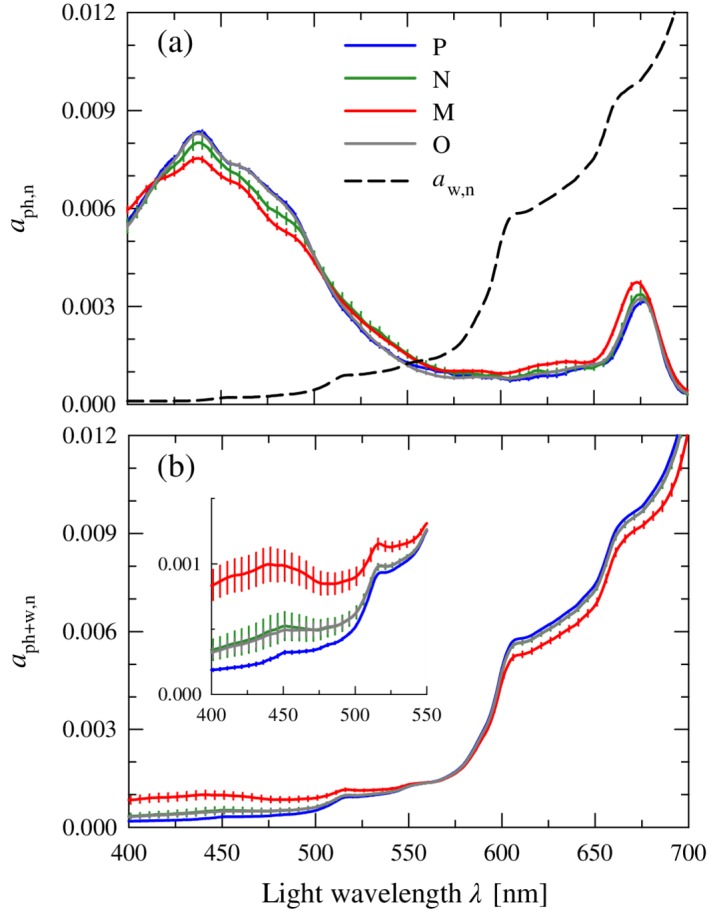
Figure 4.

(a) Normalized mean spectra of the phytoplankton absorption coefficient, a ph,n(λ), for each of the four clusters. Error bars depicting the standard error of the mean (= SD/√n) are provided at 5‐nm intervals. The normalized spectrum of the water absorption coefficient, a w,n(λ), is also shown for comparison. All spectra are normalized to the integral over the wavelength range 400–700 nm and therefore dimensionless. (b) Similar to (a) but for the summed absorption coefficient of phytoplankton and water, a ph+w,n(λ), for each of the four clusters. The inset provides an expanded view of the wavelength range 400–550 nm.
