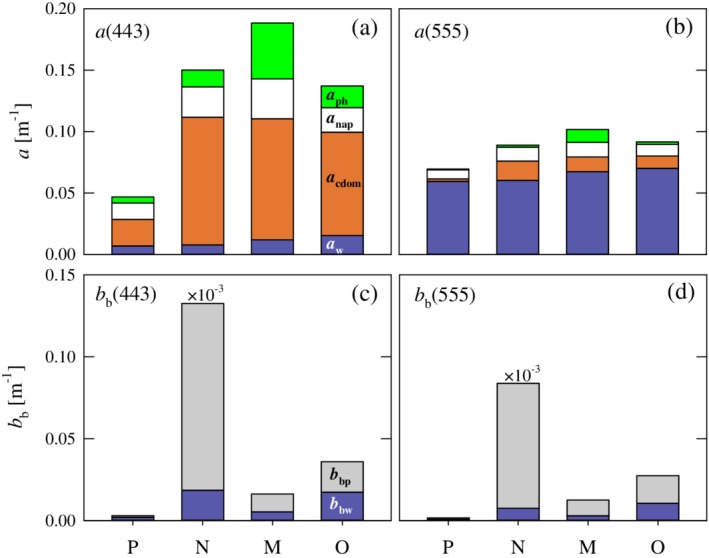
Figure 7.

(a, b) Cluster mean values of the total absorption coefficient of seawater, a(λ), at light wavelengths of 443 and 555 nm. The height of each stacked bar indicates the mean value of the absorption coefficient, which is partitioned to depict the mean relative contribution of four absorbing constituents as indicated. (c, d) Similar to a and b but for the total backscattering coefficient of seawater, b b(λ), with the relative partitioning between pure seawater and particulate matter. The values for cluster N have been multiplied by 1 × 10⁻³ to allow display on the same scale as the other clusters.
