
Figure 9.
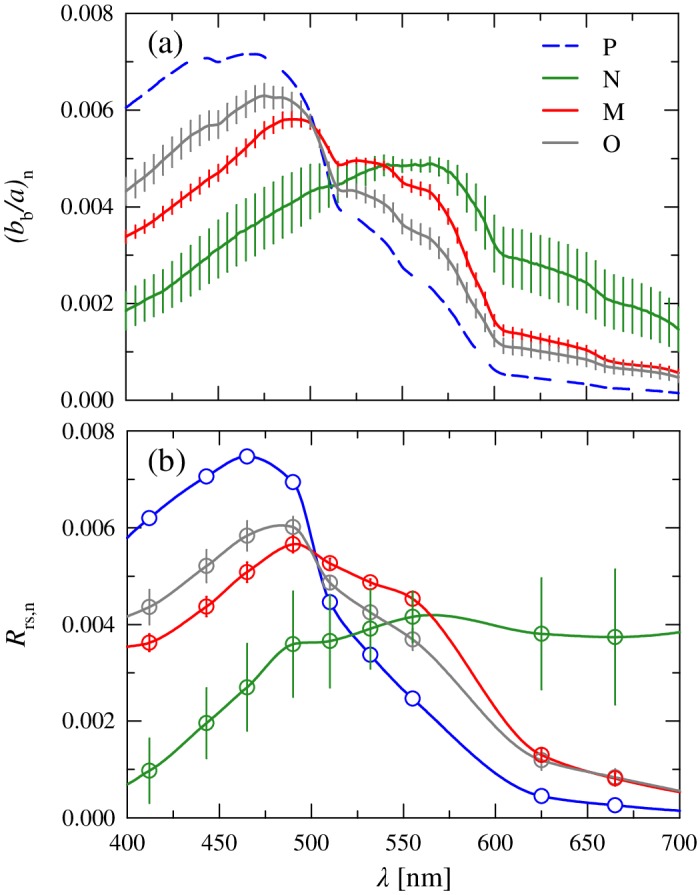
(a) Normalized mean spectra of the backscattering‐to‐absorption ratio, (b b/a)n(λ), for each of the four clusters. Error bars as in Fig. 4. The spectra for cluster P was calculated using the cluster mean values of all absorption and backscattering constituents. (b) Similar to (a) but for independent radiometric measurements of the remote‐sensing reflectance spectra, R rs,n(λ).