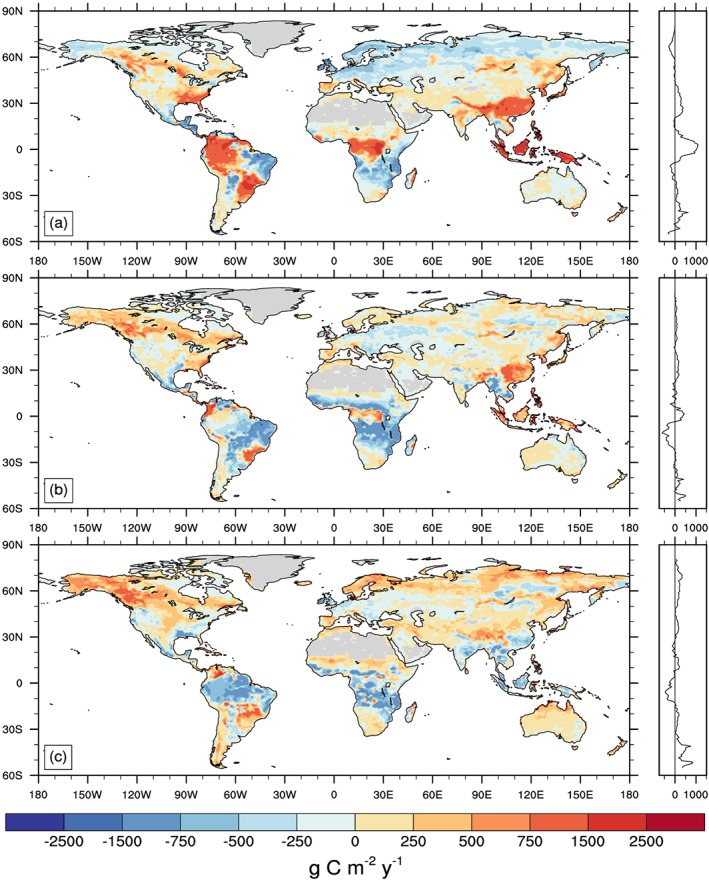
Figure 2.

Spatial distribution and zonal mean plots showing biases in mean annual GPP simulated by successive versions of the Community Land Model (a) CLM4, (b) CLM4.5, and (c) CLM5 compared to observationally derived estimates from FLUXNET‐MTE. All units are g C m−2 yr−1 and averaged over the period 1995–2008.
