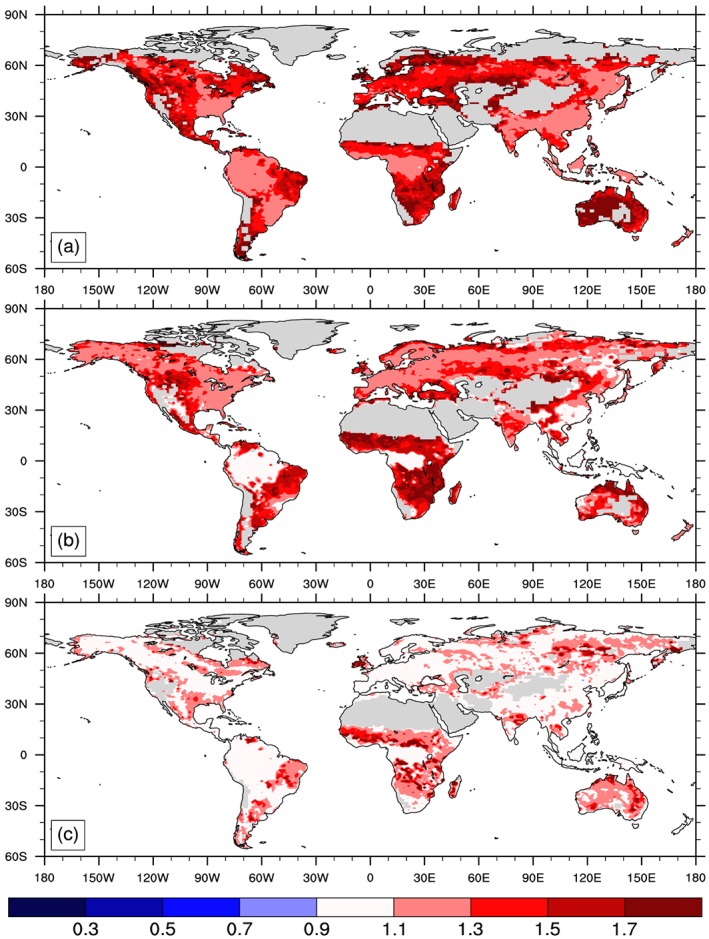
Figure 3.

Spatial distribution and zonal mean plots showing the effect size of nitrogen enrichment on GPP simulated by successive versions of the Community Land Model (a) CLM4, (b) CLM4.5, and (c) CLM5. Effect sizes were calculated for each grid cell as the mean annual GPP of treatment divided control simulations over the last five years of the experiment (2010–2014) using cells with mean GPP > 100 g C m−2 yr−1.
