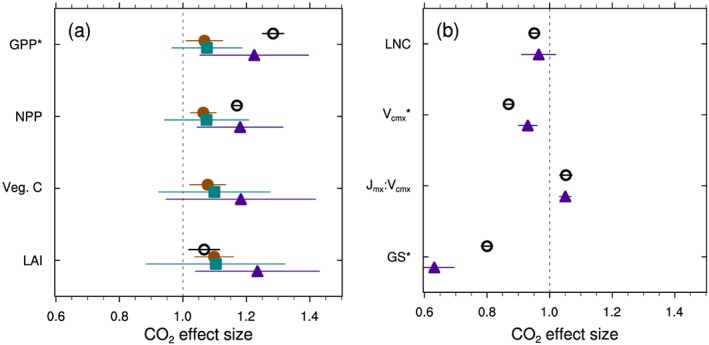
Figure 6.

Observed (open circles) and simulated (solid shapes) effect size of CO2 enrichment on various ecosystem carbon and leaf traits. Observations, where available, show the mean (±95% confidence interval; Ainsworth & Long, 2005). Modeled responses show the global mean of grid cell effect sizes (±50% prediction interval) for versions 4, 4.5, and 5 of CLM (brown circles, turquoise squares, and purple triangles, respectively), calculated using cells with mean GPP > 100 g C m−2 yr−1. The vertical dashed line represents no effect. Variables listed include (a) gross and net primary productivity (GPP and NPP), vegetation carbon pools (Veg C), leaf area index (LAI) and (b) leaf N content (LNC), maximum carboxylation rates (Vcmax), the ratio of maximum electron transport rates (Jmax) to Vcmax, and stomatal conductance (GS). Asterisk denotes values for the mean of daily maximum rates.
