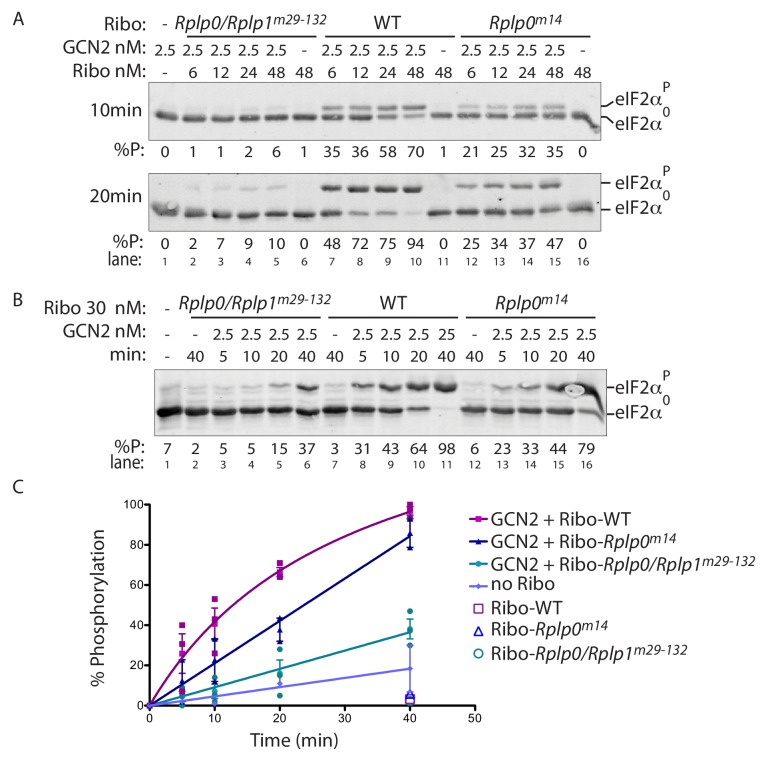
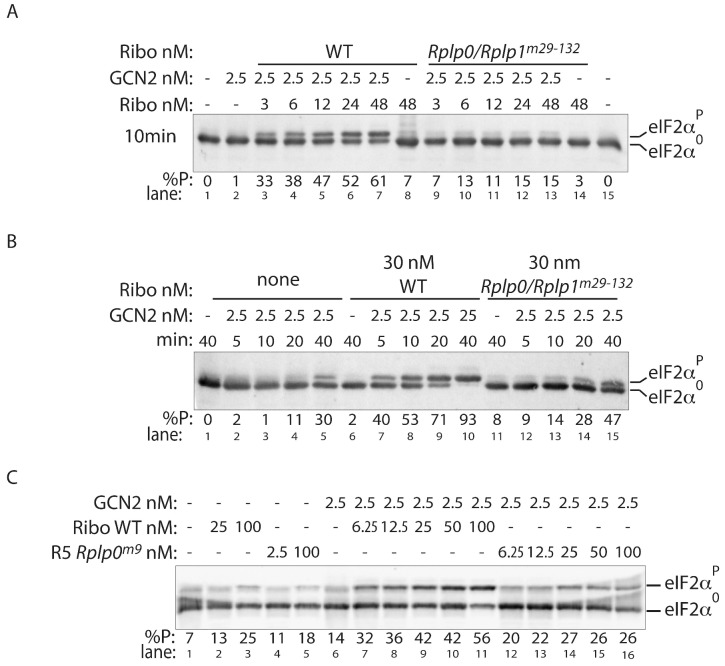
Figure 5. P-stalk lesions impair ribosome stimulation of eIF2α directed GCN2 kinase activity.
(A) Immunoblot of eIF2α from in vitro phosphorylation reactions resolved by phos-tag SDS-PAGE. The concentration of purified GCN2 kinase, ribosomes, and the genotype of the ribosomes is indicated above the panel. The fraction of phosphorylated eIF2α is below the panel, the incubation time is on the left, and the migration of the phosphorylated (eIF2αP) and non-phosphorylated protein (eIF2α0) is on the right. (B) A time course of eIF2α phosphorylation reactions with 30 nM ribosomes annotated as in ‘A’ above. (C) Graph depicting the percent phosphorylation plotted against time from reactions shown in ‘B’ above and two similar experiments, all data points are shown along with the mean and range. (Shown are representative of experiments reproduced more than three times with independently isolated wildtype and mutant ribosomes).


