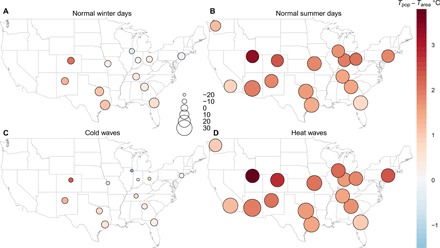
Fig. 1. Population dynamics–induced changes in residents’ exposure temperature (Tpop− Tarea) during simulated extreme events.

(A) In normal winter days and (C) during the 2014 cold wave. (B) In normal summer days and (D) during the three simulated heat waves in 2006, 2011, and 2012. Each circle represents a metropolitan area affected by the extreme event, and its size is proportional to the magnitude of exposure temperature averaged over the entire metropolitan area without population dynamics (Tarea). The magnitude of changes for individual cities is referred to table S2.
