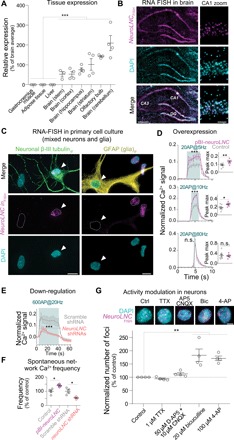
Fig. 3. NeuroLNC is neuron specific and nuclear, regulates presynaptic Ca2+ influx, and is modulated by neuronal activity.

(A) Relative expression of neuroLNC in the rat central nervous system (CNS) and other tissues, as measured by quantitative real-time PCR (qRT-PCR). Statistical test, one-way ANOVA followed by Bonferroni’s multiple comparison test versus all non-CNS samples (***P < 0.001). (B) RNA fluorescence in situ hybridization (RNA-FISH) of neuroLNC on coronal brain slice of rat (P14). Note the localization to the nuclei of CA1 neurons in the zoom. Scale bars, 0.5 mm (left); 50 μm (right). DAPI, 4′,6-diamidino-2-phenylindole. (C) Combined RNA-FISH and immunofluorescence in primary mixed neuroglial cultures. Note that β-III tubulin–positive neurons are neuroLNC positive (left, white arrowhead), while cells positive for the glial marker glial fibrillary acidic protein (GFAP) are neuroLNC negative (right, white arrowhead). Scale bars, 10 μm. (D) Quantification of Ca2+ influx in primary hippocampal neurons upon neuroLNC overexpression following a 20-AP field stimulation at different frequencies. Mean values are plotted (± SEM). Insets indicate the difference in fluorescence measured at the maximum peak for each experiment. Statistical test, unpaired two-tailed Student’s t test (*P < 0.05; **P < 0.01; and ***P < 0.001). See fig. S5 for details. (E) Quantification of Ca2+ influx as in (D), following shRNA-mediated neuroLNC down-regulation with a 600-AP stimulation at 20 Hz. Upon neuroLNC down-regulation, Ca2+ influx is significantly decreased. (F) Physiological (unstimulated) network activity measured in neurons following overexpression or down-regulation of neuroLNC. Overexpression increases spontaneous activity, while down-regulation has the opposite effect. Unpaired two-tailed Student’s t test (*P < 0.05). (G) The number of neuroLNC foci following activity modulation of neurons. Blocking the activity of neurons with TTX or AP5 + CNQX has no effect. The number of neuroLNC foci is promoted by increasing neuronal activity by applying bicuculline or 4-AP. In the upper panels, representative images are shown. Scale bar, 5 μm. Normalized averages are shown. One-way ANOVA followed by Bonferroni’s multiple comparison test versus control (**P < 0.01).
