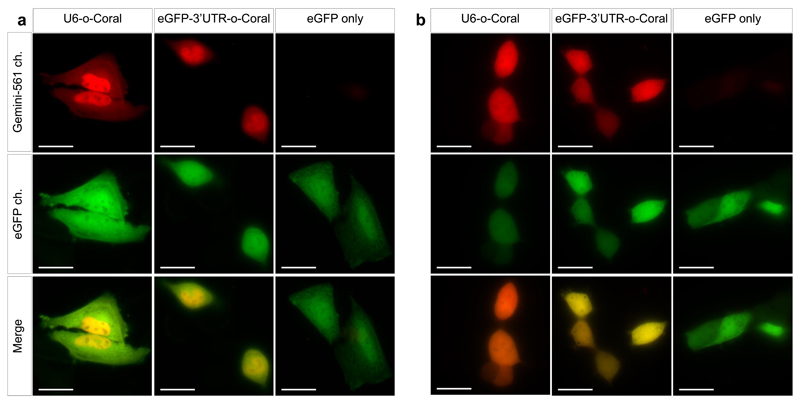
Figure 4. Live-cell imaging of o-Coral expressed from pol. II and pol. III promoter.
Live cell imaging of HeLa (a) and HEK293T (b) cells expressing U6-o-Coral, the egfp mRNA eGFP-3’UTR-o-Coral, or eGFP only. Cells were incubated with Gemini-561 (200 nM) for 5 min before imaging. Hoechst was used to stain the nucleus (5 μg/mL). The images were acquired using a 500 ms exposure time. Gemini-561 in red (ex: 550 nm, em: 595±40 nm) and eGFP in green (ex: 470 nm, em: 531±40 nm). Results were found similar in n = 3 independent experiments. Scale bar is 30 μm.

