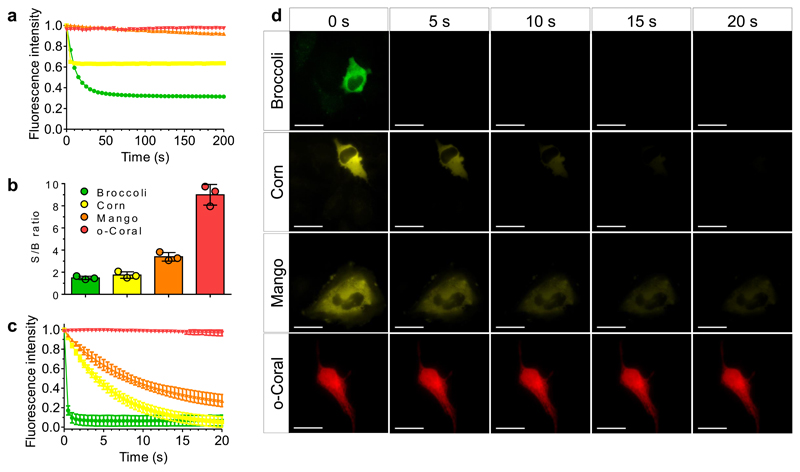
Figure 5. Comparative analysis of photostability by fluorescence microscopy and spectroscopy.
(a) Photostability of G561/o-Coral (0.2 μM/1 μM) compared to Broccoli+DFHBI-1T (0.2 μM/1 μM), Corn+DFHO (0.2 μM/1 μM), Mango + TO1-Biotin (0.2 μM/1 μM). Each complex was excited at the same molar extinction coefficient value: 30,000 M-1 cm-1. Broccoli, Corn and Mango were excited using 488 nm laser (7.75 mW cm-2, 11 mW cm-2, 10 mW cm-2 respectively) and o-Coral was excited using 532 nm laser (7 mW cm-2). Fluorescence intensity was monitored at 507 nm for Broccoli, 545 nm for Corn, 535 nm for Mango and 596 nm for o-Coral. (b-d) Photostability and signal to background noise ratio measurement in live Hela cells. In vitro transcribed and purified aptamers were preincubated with respective fluorogenic dyes for 10 min in selection buffer to form complex. Complexes were microinjected in live HeLa cells using 5 μM dye and 20 μM aptamer concentration. Microinjection parameters: Pi=90 [hPa]; Ti=0.3 [s]; Pc=10 [hPa]. Consecutive images were acquired, each using a 500 ms exposure time. The excitation power was adjusted for the fluoromodules to absorb similar amount of photons. Broccoli (ex: 470 nm, em: 475±50 nm); Corn (ex: 470 nm, em: 531±40 nm); Mango (ex: 470 nm, em: 531±40 nm); Coral (ex: 550 nm, em: 595±40 nm). (b). Signal to background noise ratio of the first acquired image depicting the brightness of the system and the quality of obtain images. Signal to background noise ratios were calculated from fluorescence intensity values extracted from images using same region of interest from n = 3 independent injections. The value of each measurement is shown as a colored dot. The error bars correspond to ± 1 standard deviation. (c) Fluorescence intensity decay curves over the time. Data represent average values ± 1 standard deviation extracted from images from n = 3 independent experiments. (d) Representative micrographs taken during the experiment. Results were found similar in n = 3 independent experiments. Scale bar is 30μm.

