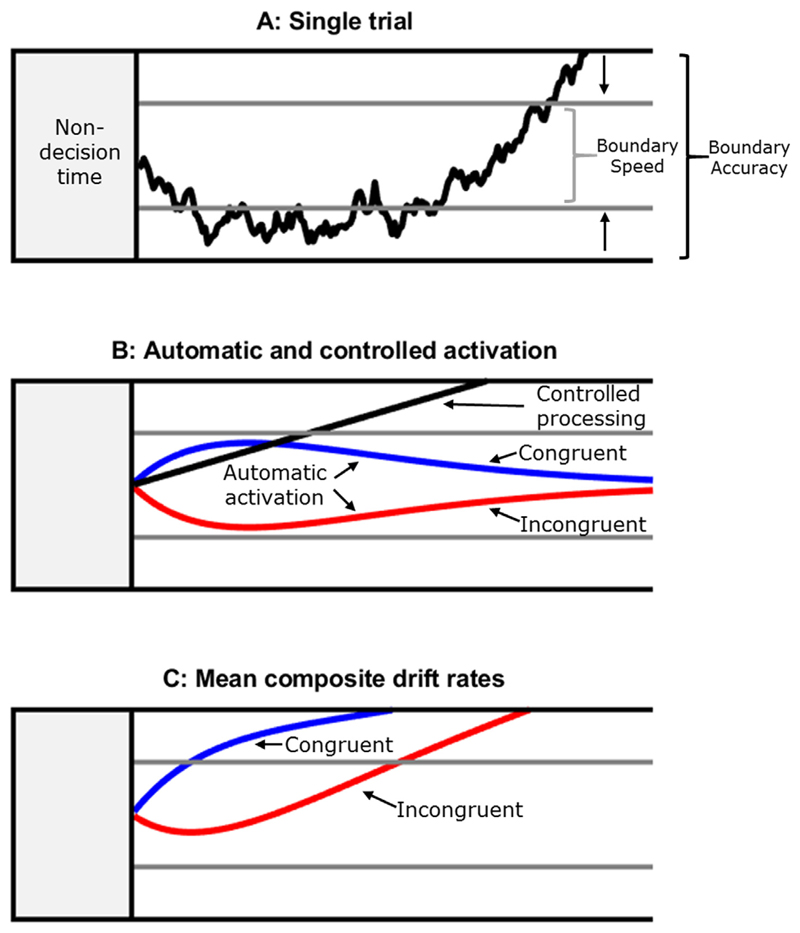
Fig. 2.
Schematic of the diffusion model for conflict tasks (Ulrich et al., 2015). Panel A shows the noisy accumulation of evidence to a boundary on a single trial. It is assumed that when speed is emphasised, participants set the boundary (grey line) closer to the start of the accumulation processes than under accuracy emphasis (black horizontal line), corresponding to waiting for less evidence before making a response. A small distance between the upper and lower boundary leads to faster RTs, but an increased likelihood of hitting the lower boundary, producing an error. This change in boundary between accuracy and speed emphasis, represented by the arrow, is the strategic adjustment of response caution that is the focus of this study. Panel B shows the average underlying patterns of activation. The black diagonal line corresponds to the speed of controlled processing, represented by a drift rate parameter. The blue and red functions represent automatic activation in congruent and incongruent trials respectively. The function initially receives a strong input until reaching a maximum value (amplitude parameter) at a point defined by the time-to-peak parameter. Panel C shows the composite drift rates for congruent and incongruent trials. (For interpretation of the references to colour in this figure legend, the reader is referred to the web version of this article.)

