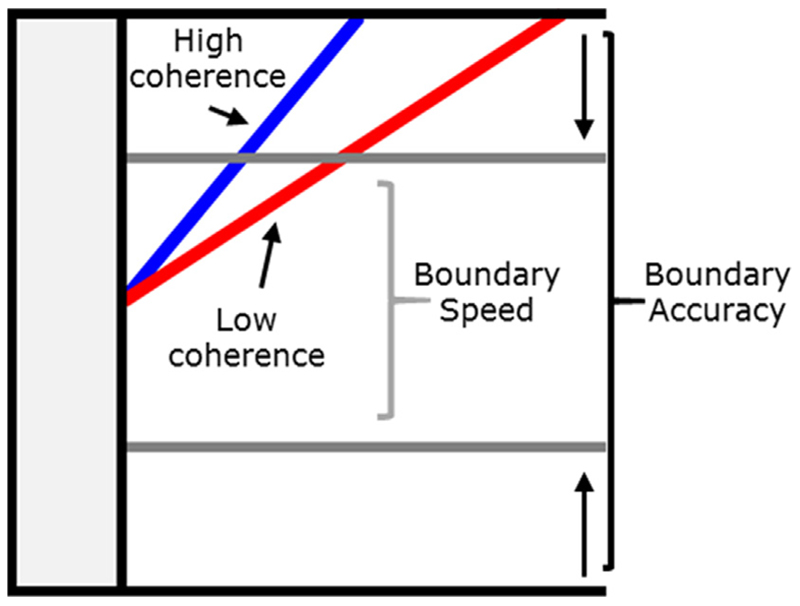
Fig. 6.
Schematic of the average underlying processing in the drift-diffusion model (DDM; Ratcliff, 1978; Ratcliff & Rouder, 1998). The blue and red lines correspond to evidence accumulation rates to stimuli with more and less information respectively. Strategic changes in response caution are captured by lowering the boundary when speed is emphasised. (For interpretation of the references to colour in this figure legend, the reader is referred to the web version of this article.)

