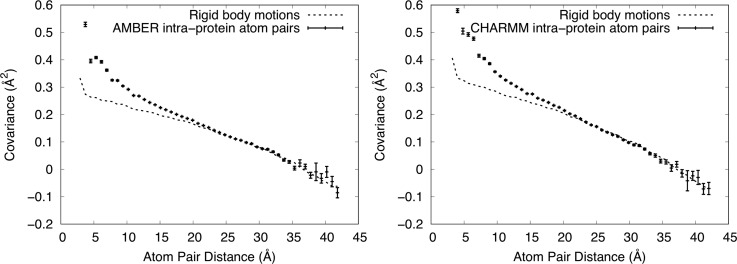
FIG. 5.
Dependence of covariance on distance for only intraprotein Cα atom pairs. Mean values of covariance ± standard errors from the MD simulations are shown using vertically oriented error bars. Values computed from RBM models are shown using dashed lines (standard errors are O(10−5) Å2 and are therefore not shown). The upper y-range is truncated at 0.6 Å2, showing the full range of the exponential fit but excluding one high covariance value at the shortest distance from the MD values in each panel. Left: AMBER force field. The RBM model has a width (SD) 0.95° for the angular distribution and 0.24 Å for the translational distribution. Right: CHARMM force field. The RBM model has a width (SD) 1.05° for the angular distribution and 0.27 Å for the translational distribution. The MD simulations are well modeled using rigid-body translations and rotations for distances greater than 20 Å.

