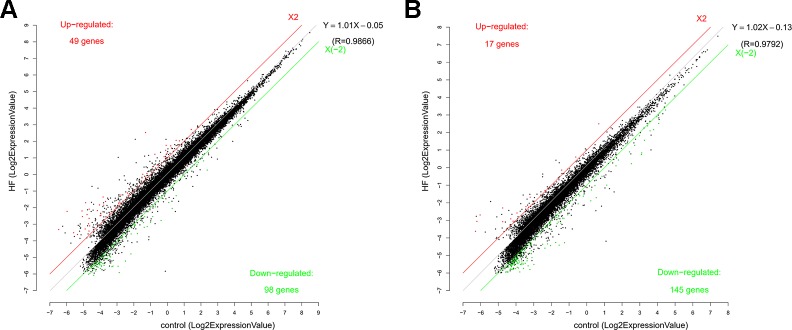
Figure 2.
Scatter function of messenger RNA (RNA) (A) and long non-coding RNA (lncRNA) (B) expression profiles in heart failure (HF) compared with controls. The number of up-regulated and down-regulated mRNAs and lncRNAs were given in the figure. The values of the X and Y axes in the scatter plot were the averaged normalized signal values of the HF and sham-operated group (log2 scale). The red line and the green line were threshold boundary lines for up-regulated or down-regulated mRNAs and lncRNAs respectively (the significant fold change given was 2.0). The black line was the fitting line of total expression and the fitting equation was calculated. R represented the related coefficient of two group samples.

