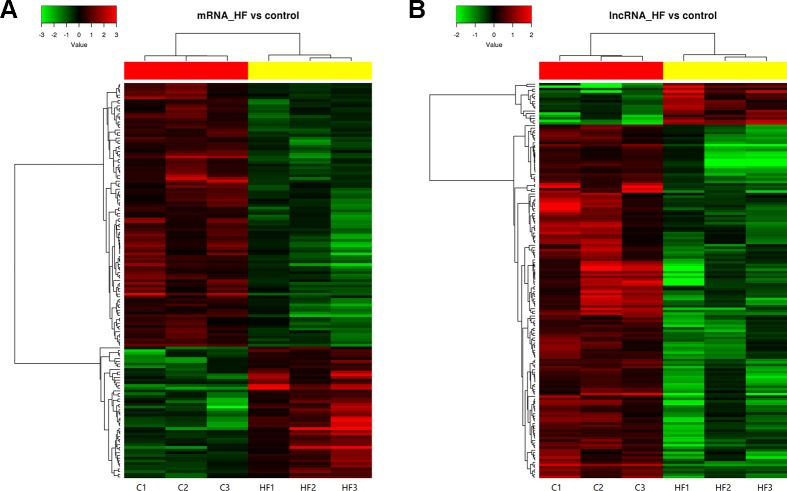
Figure 4.
Heat map and hierarchical clustering of messenger RNA (mRNA) (A) and long non-coding RNA (lncRNA) (B) expression profiles in heart failure compared with controls. Each column represented one sample, and each row represented one mRNA or lncRNA. The relative expression levels of mRNAs and lncRNAs were depicted according to the color scale. Red indicated up-regulation and green indicated down-regulation. 2.0 and −2.0 were fold changes in the corresponding spectrum, whereas left three columns represented control samples and right three columns represented HF samples. The differentially expressed mRNAs and lncRNAs were clearly self-segregated into clusters.

